

A new version of Lightbend Telemetry, Cinnamon 2.4, has been released and features OpenTracing integration.
Building distributed systems at scale has its challenges and Lightbend Telemetry equips DevOps teams with observability tools that provide insight into systems created on the Lightbend Platform. The metrics and events in Cinnamon are very helpful, but these can’t be used to reconstruct the paths that messages and requests take across a distributed system. Distributed tracing records these flow paths.
Distributed tracing can be used for optimizing end-user latency (the trace gives a breakdown of where time has been spent in distributed requests), root-cause analysis for errors (errors can be annotated in the trace and show how other parts of a distributed system relate to an error), and understanding the bigger picture of the system (traces can give insight into the distinct pieces of a distributed system and how they are connected).
OpenTracing is a recently developed, open standard for distributed tracing. OpenTracing provides a common API for instrumenting distributed systems without binding to a particular tracing vendor. OpenTracing is based on earlier work in tracing, including Dapper and Zipkin.
At the heart of distributed tracing is context propagation — moving the trace context across asynchronous boundaries (between actors or threads within a process) and across remote boundaries (between distributed processes). Cinnamon instrumentation has built-in context propagation, and we’ve integrated our instrumentation layers with the OpenTracing API to provide distributed tracing for Akka Actors. Distributed context propagation is also the foundation for the SLF4J MDC support in Cinnamon.
As an example, here’s a simple message flow across actors:

Actors A and B are running in one actor system, and actors C and D are running in another actor system on a different node. Actor A sends messages to actors B and C (in the other actor system), and actor C sends a message to actor D.
Here’s what a possible trace for this message flow looks like conceptually:
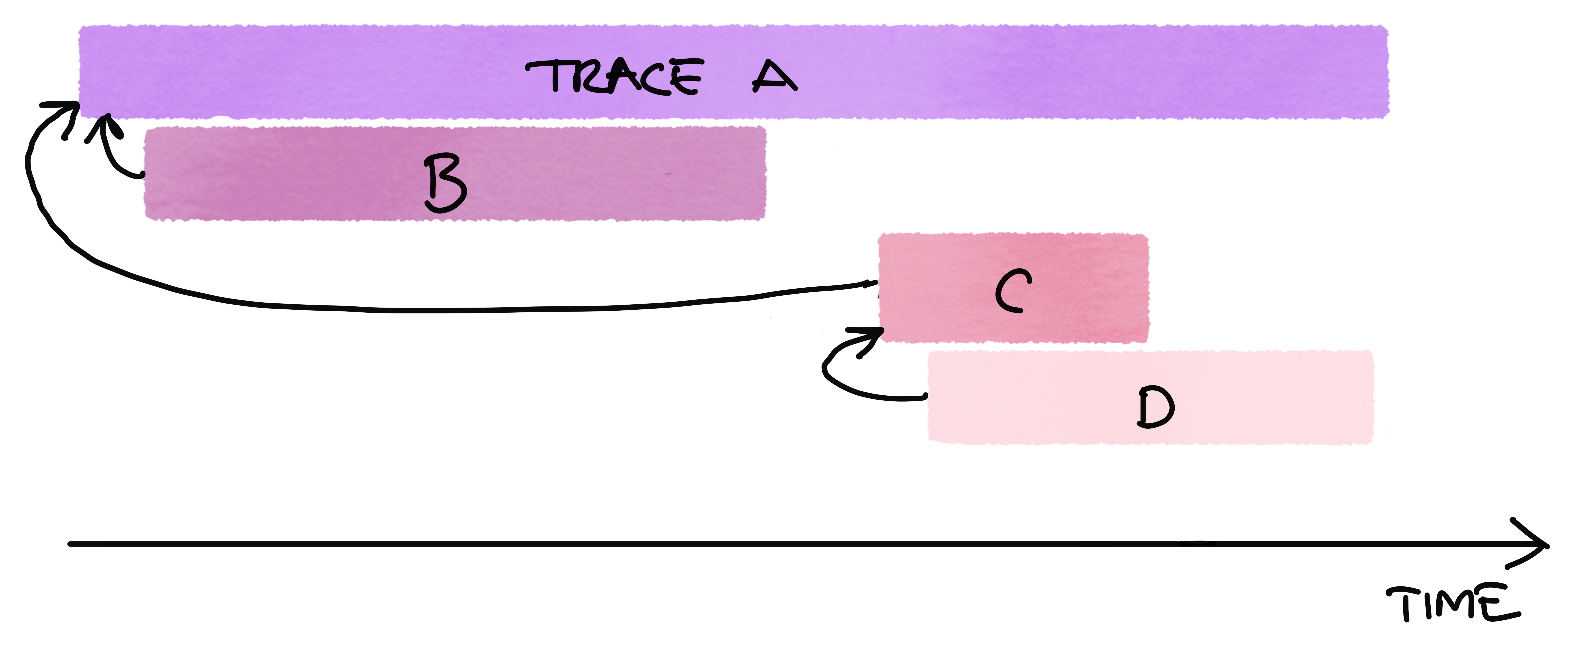
A trace shows a dataflow or an execution path through a distributed system. Each span in the trace represents a logical unit of work. In the case of actors, each span represents the processing of a message by an actor. The duration of the span is recorded. Spans may be nested to model causal relationships, with spans referencing other spans, and for actor tracing these relationships are message sends. Events can be logged within a span.
Here’s an example of an actor trace visualized in Zipkin:
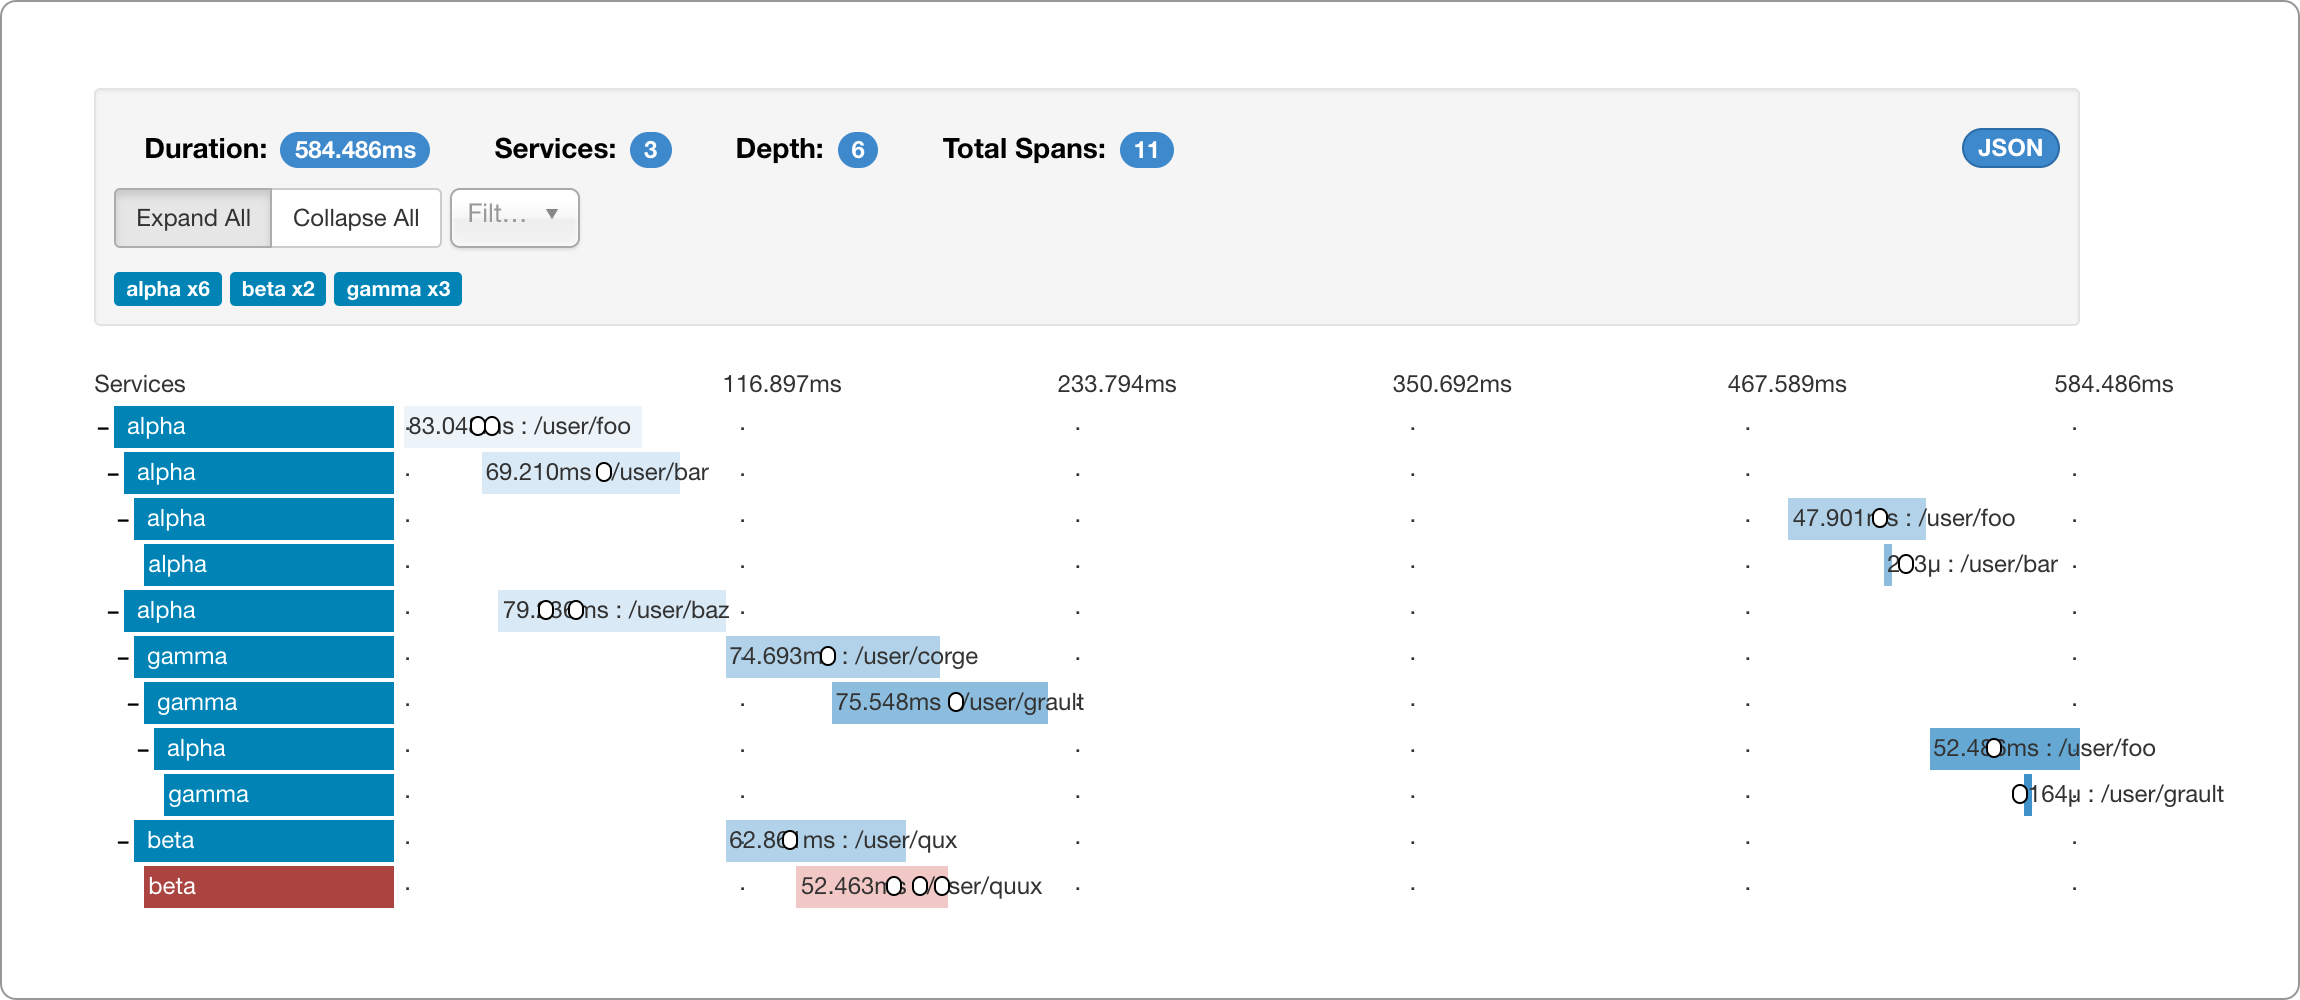
The actor trace shows the flow of messages and records when messages were processed and how long it took to process each message. Message sends to other actors are logged within the trace span, as well as any actor events such as actor failures, unhandled messages, dead letters, or logged errors and warnings. The red span indicates that message processing ended in an actor failure.
Here are the details for one of the spans:

Message sends to other actors are annotated in the span. A string representation of the message being processed and the sender actor are also recorded for all actor spans.
For message sends to remote actors, the full path of the actor will be recorded:

The red span in the trace above shows that message processing ended in an error. Here are the span details for an error:

The actor failure is recorded, as well as any logged errors and warnings.
The Cinnamon OpenTracing integration currently supports the Jaeger and Zipkin distributed tracing systems.
You can find out how to enable tracing for your Akka applications in the Cinnamon documentation for OpenTracing.
The Lightbend Telemetry team is working on expanding the instrumentation supported by Cinnamon and its tracing integration. Akka HTTP, Play, and Futures are next. We’re also exploring ideas for visualizing trace flows in aggregate, and we’re considering the ideas in Pivot Tracing, an interesting project that combines context propagation with dynamic instrumentation.
If you’re interested in learning more about OpenTracing and its applications, this talk by Ben Sigelman gives a good overview.
Try out Cinnamon 2.4. Feedback, questions, and ideas are all welcome.
