
We’re excited to release the latest version of Lightbend Enterprise Suite’s Monitoring/Telemetry, a.k.a. Cinnamon, which includes support for Play Framework 2.6+ metrics and tracing, a new Docker-based sandbox environment, and a new JVM metrics module, among other things.
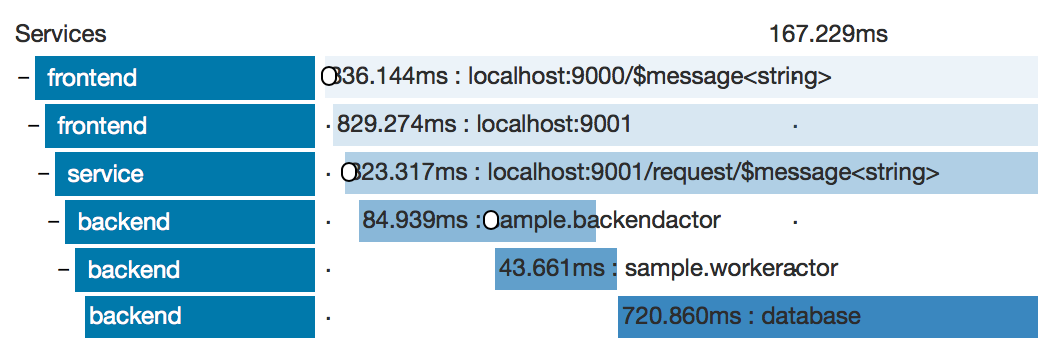
The Play support in Cinnamon gives the user both server and client metrics as well as support for OpenTracing. This provides all the tools necessary to diagnose server and client health as well as optimizing end-user latency or doing error root-cause analysis across multiple services.
Support for Play MDC will become available in an upcoming minor release of Cinnamon.
Play 2.6 uses Akka HTTP under the hood and Cinnamon can, therefore, reuse the implementation that already exists for Akka HTTP metrics and tracing. In fact, the metrics that are generated by the Cinnamon Play module are identical to the Akka HTTP metrics. Play WS client metrics and tracing is also supported in Cinnamon although it does not use Akka HTTP internally.
Information about what server and client metrics that are available and how to get started with Play tracing.
At this point, we have no plans to implement Cinnamon support for older versions of Play. Contact us via Lightbend support if you feel that you need Cinnamon for an older version and we will try to accommodate your request.
The Play support is the primary functionality shipped in 2.7, but there are some other features worth mentioning as well.
Prometheus provides complete container cluster monitoring: instrumentation, collection, querying, and alerting. Monitoring is an integral part of ensuring infrastructure reliability and performance through observability, and Prometheus is a unified approach to monitoring all the components of a Kubernetes cluster, including the control plane, the worker nodes, and the applications running on the cluster.
Cinnamon now supports Prometheus as a backend which means that it is possible to use the existing Prometheus infrastructure to store and retrieve metrics without any additional dependencies. Information about how to get started with using Cinnamon and Prometheus can be found here.
Cinnamon has a new JVM metrics module that uses the java.lang.management.ManagementFactory to get the underlying metric beans. This is the preferred way to get JVM related metrics from Cinnamon. The existing module, JVM metrics, has been deprecated and will be removed in the next major release of Cinnamon. More information about the JVM metrics producer.
The Cinnamon sandbox environment provides an easy way to run a test backend in which Elasticsearch, Kibana, and Grafana, with prepopulated dashboards, are used to visualize the metrics.
There is now a new, Docker-based sandbox environment. Follow these instructions on how to run Cinnamon with the sandbox environment.
We are interested in getting feedback on how we can improve making sure that Cinnamon provides the necessary insight into your applications. If you have any suggestions or comments, reach out to us at Lightbend support.
