View traces
Kalix projects have the traces dashboard built-in as part of the Control Tower in the Kalix Console. This is available out-of-the-box. You can find your traces here as long as you have enabled the traces in your service.
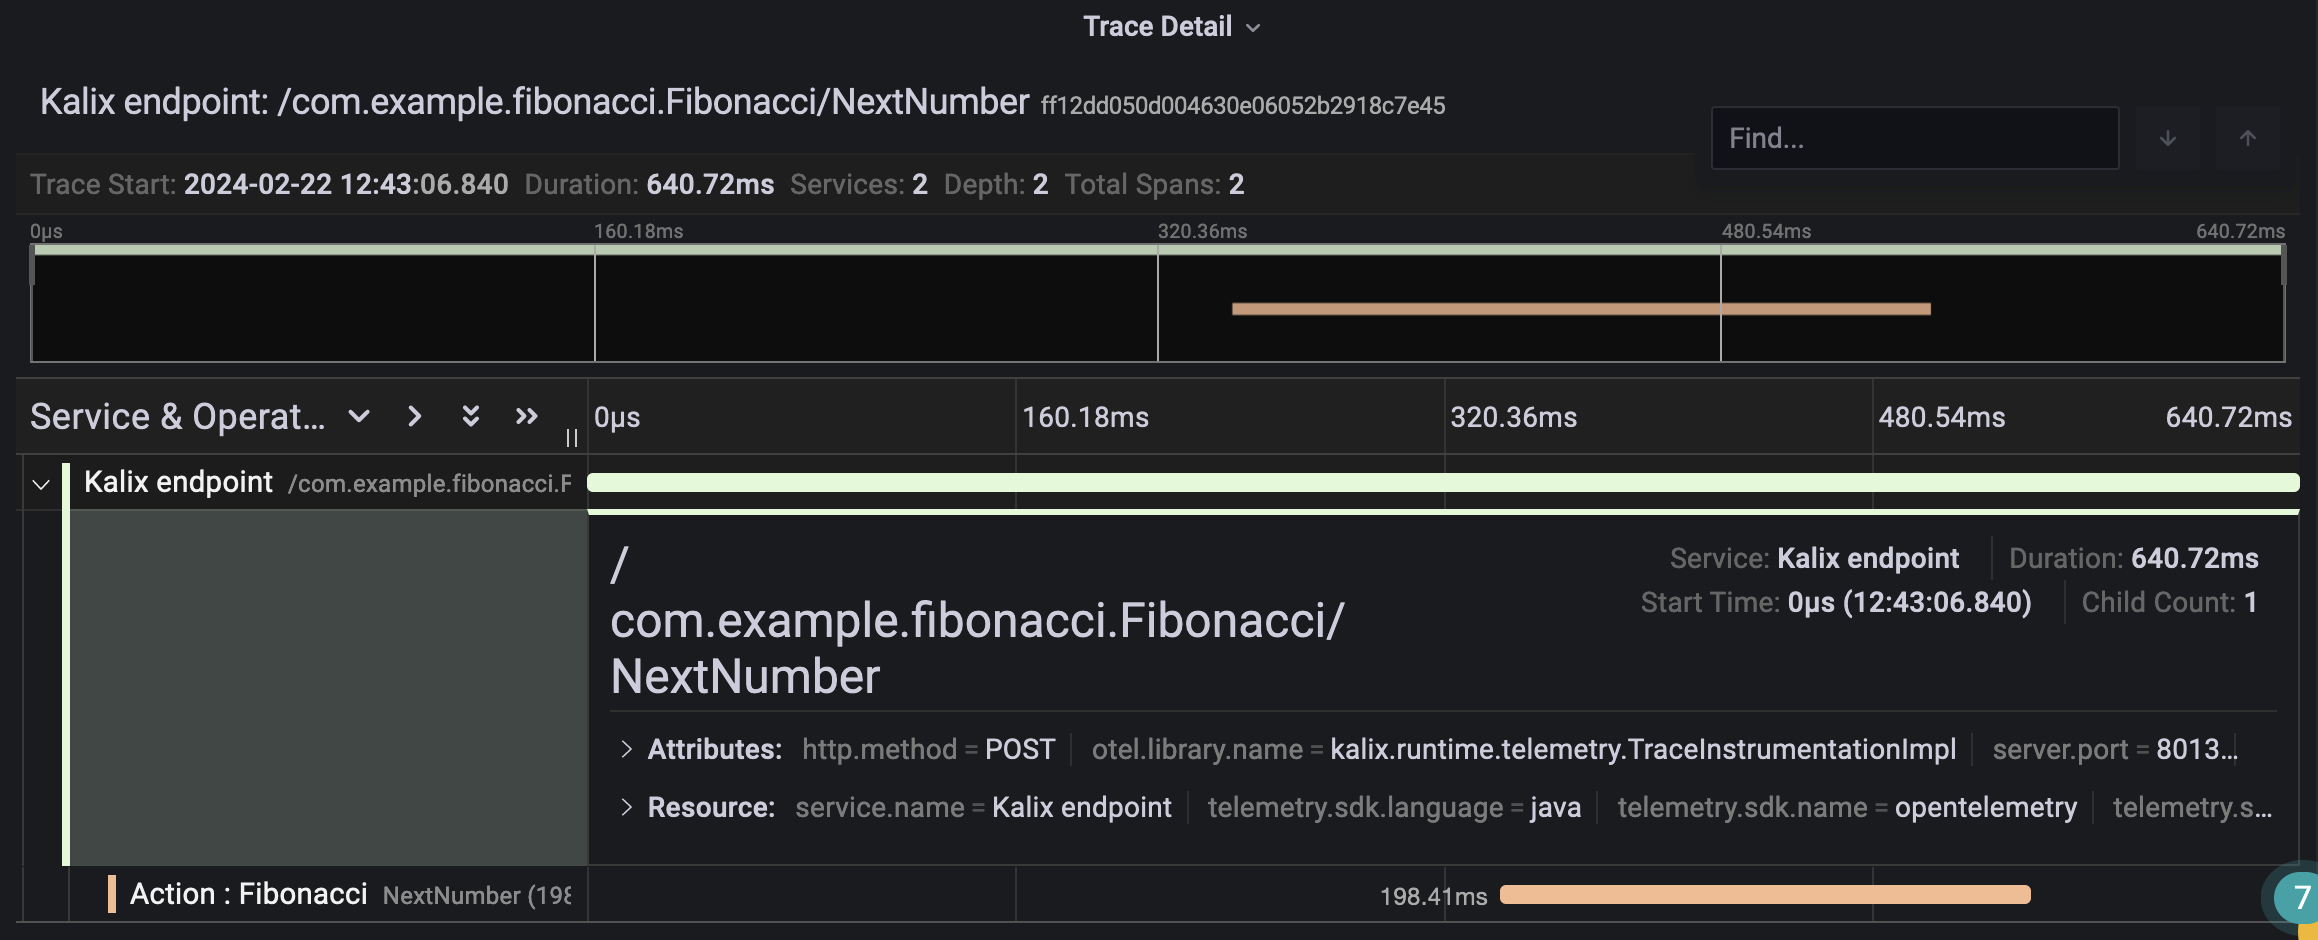
In the top panel you have the list of traces you can inspect. When you click on one of them, the contents of the trace are displayed in the panel below. As shown in the figure.
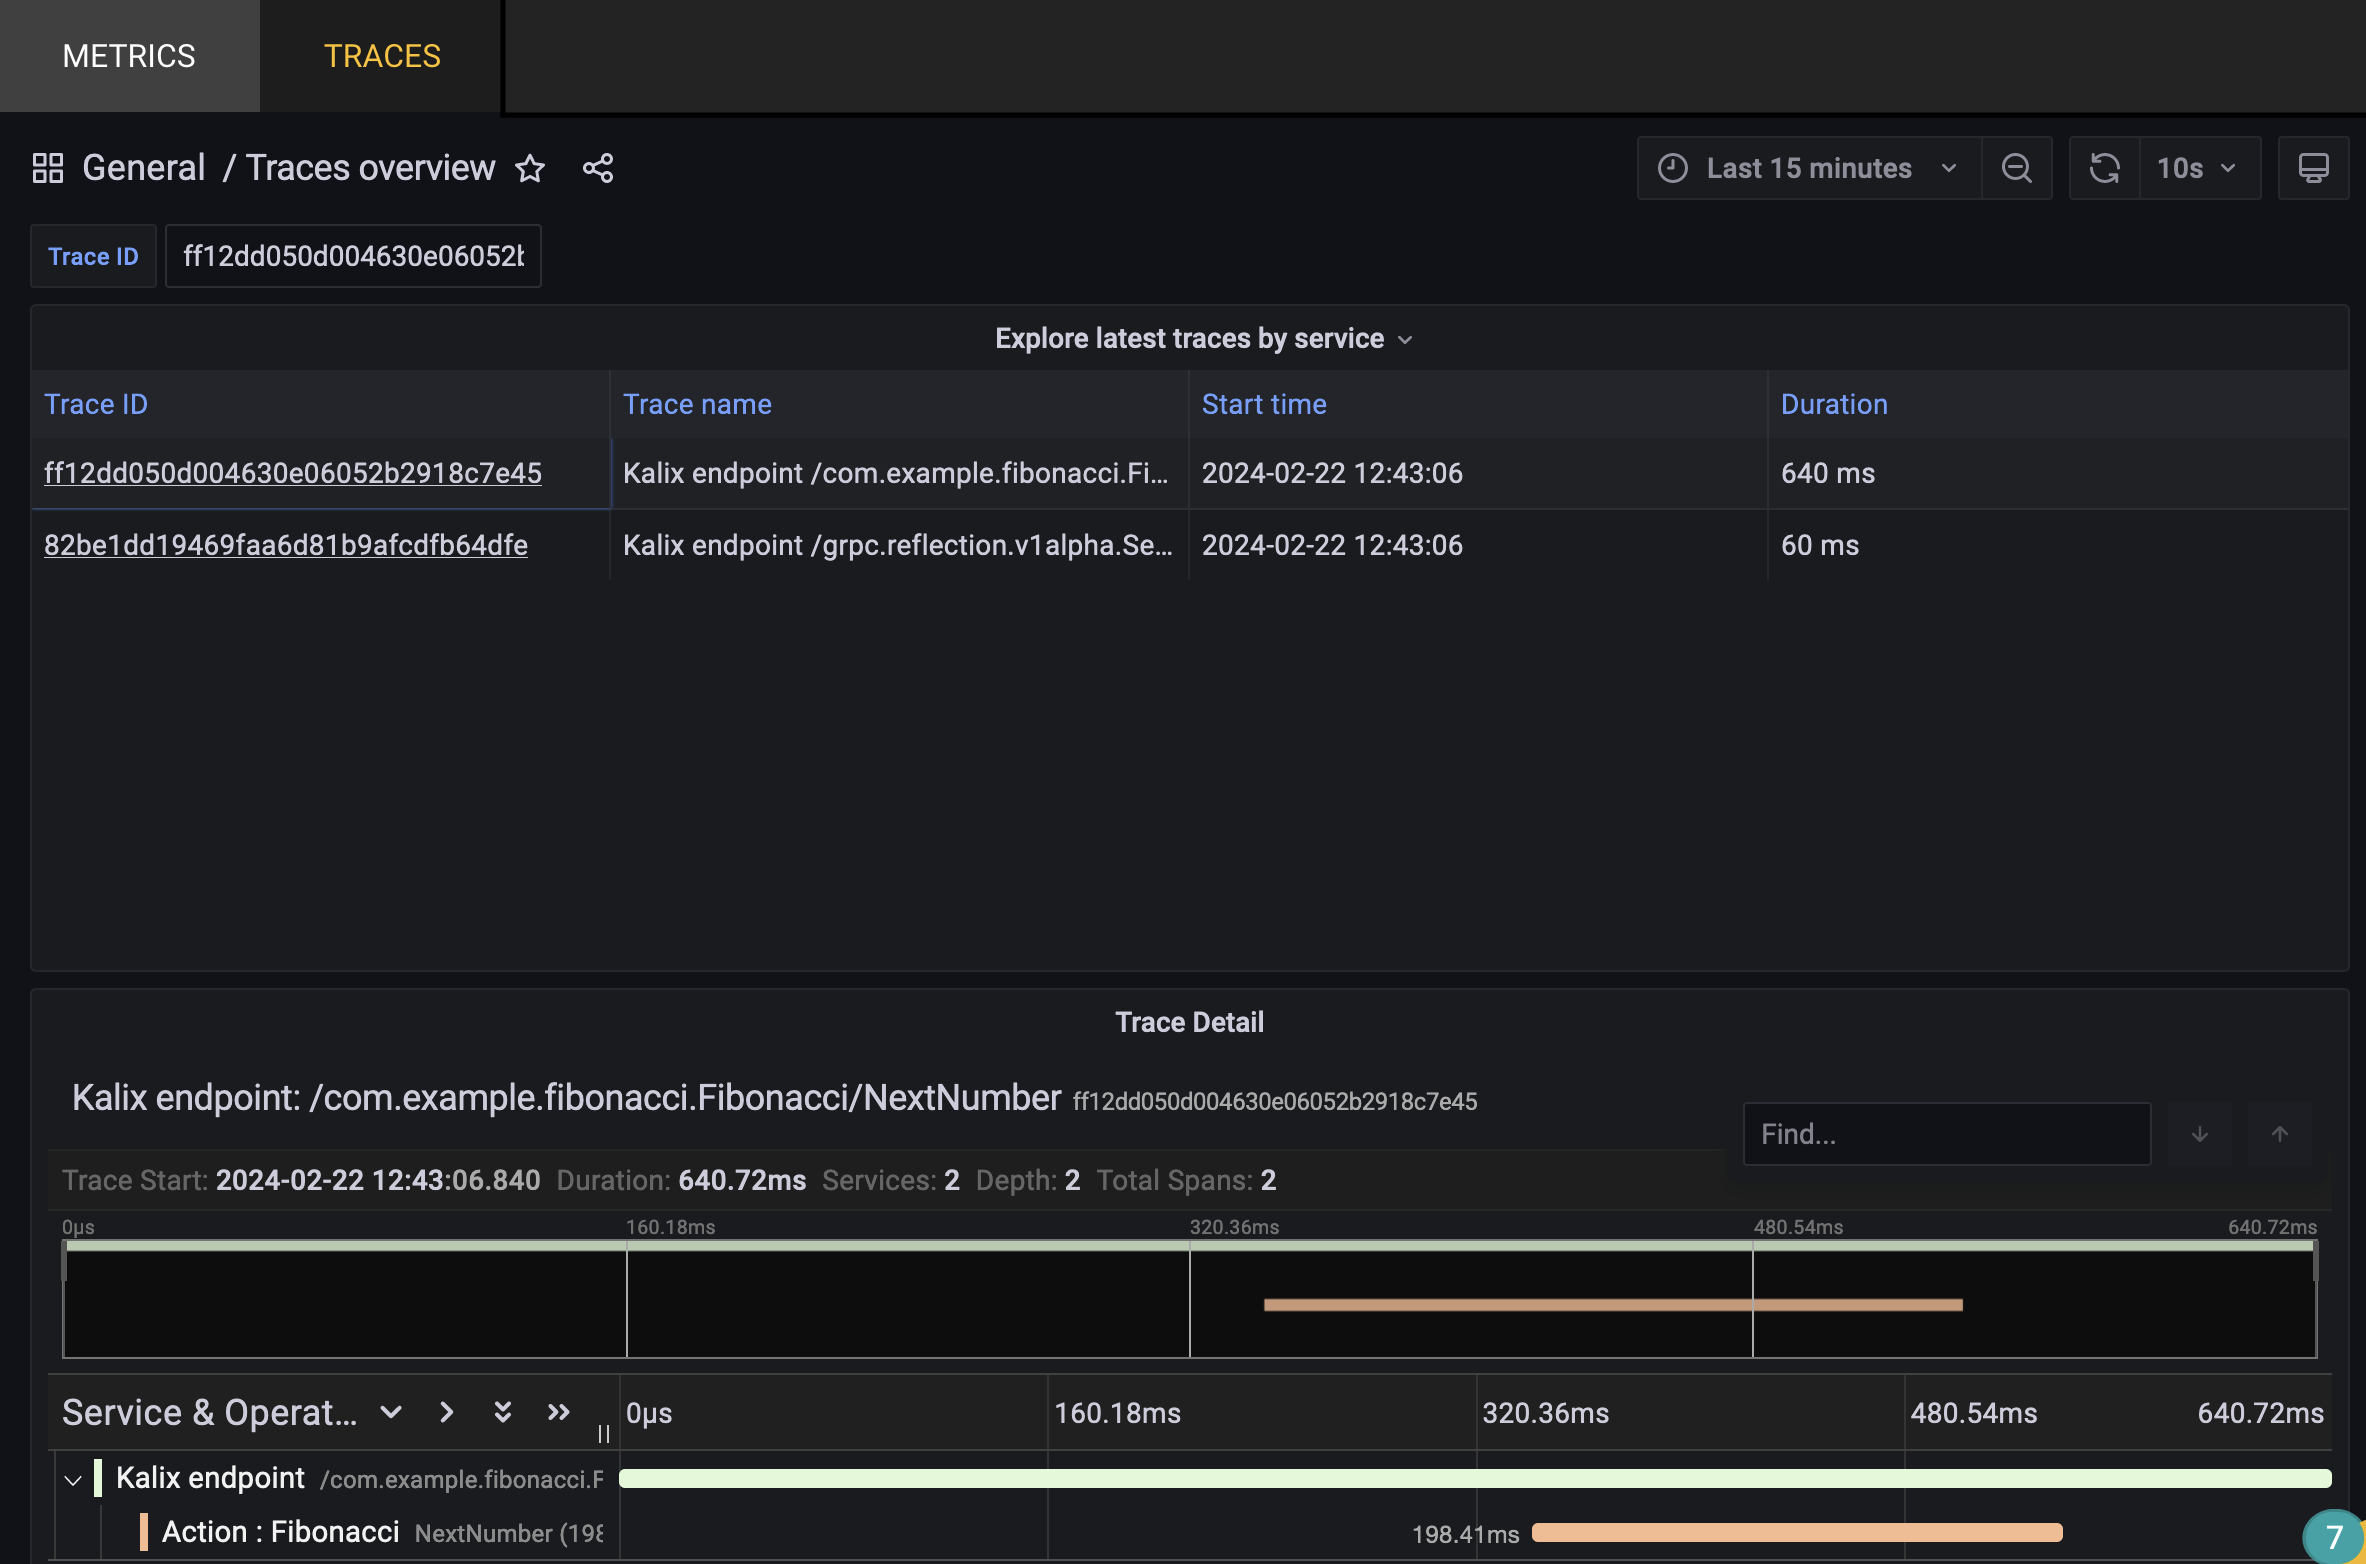
You can filter by time to select traces in the desired time period. And further select the spans of a trace to find out more details about its attributes and resources, as shown in the figure.