Akka Stream extended telemetry
In addition to the core metrics that are recorded for instrumented Akka Streams, extended telemetry can be enabled for recording end-to-end flow time, stream demand, latency, and per connection metrics.
The following metrics can be enabled, type of metric in parentheses:
-
Stream flow time (recorder) — the time for elements to flow through the stream from sources to sinks (uses a Stopwatch internally).
-
Stream flow active time (recorder) — the active time during the flow, provided by the Stopwatch, and allowing flow efficiency to be measured.
-
Stream flow efficiency (recorder) — the efficiency of end-to-end flows, based on how much time was spent actively processing as compared with waiting. Recorded as a percentage using
active time / total flow time. -
Operator flow time (recorder) — the time for elements to flow through the stream from sources to being completed by an operator, providing a progress metric for flows.
-
Operator latency (recorder) — the time spent waiting for elements from upstream (the time from demanding an element upstream with a pull to starting to process an element from a push).
-
Operator demand (rate) — the rate of demand on an operator.
-
Operator demand processing time (recorder) — the time for processing demands on an operator.
-
Operator demand latency (recorder) — the time spent waiting for demand from downstream (the time from providing an element downstream with a push to starting to process demand from a pull).
-
Connection throughput (rate) — the rate of elements that have been processed on a connection.
-
Connection processing time (recorder) — the time for processing elements pushed downstream on a connection.
-
Connection latency (recorder) — the time spent waiting for elements from upstream (the time from demanding an element upstream with a pull to starting to process an element from a push).
-
Connection demand (rate) — the rate of demand on a connection.
-
Connection demand processing time (recorder) — the time for processing demands on a connection.
-
Connection demand latency (recorder) — the time spent waiting for demand from downstream (the time from providing an element downstream with a push to starting to process demand from a pull).
-
Boundary throughput (rate) — the rate of events that have been processed on an internal async boundary.
-
Boundary processing time (recorder) — the time for processing elements pushed downstream on an internal async boundary.
-
Boundary demand (rate) — the rate of demand on an internal async boundary (includes batched demand requests).
-
Boundary demand processing time (recorder) — the time for processing demand requests on an internal async boundary.
Flow metrics
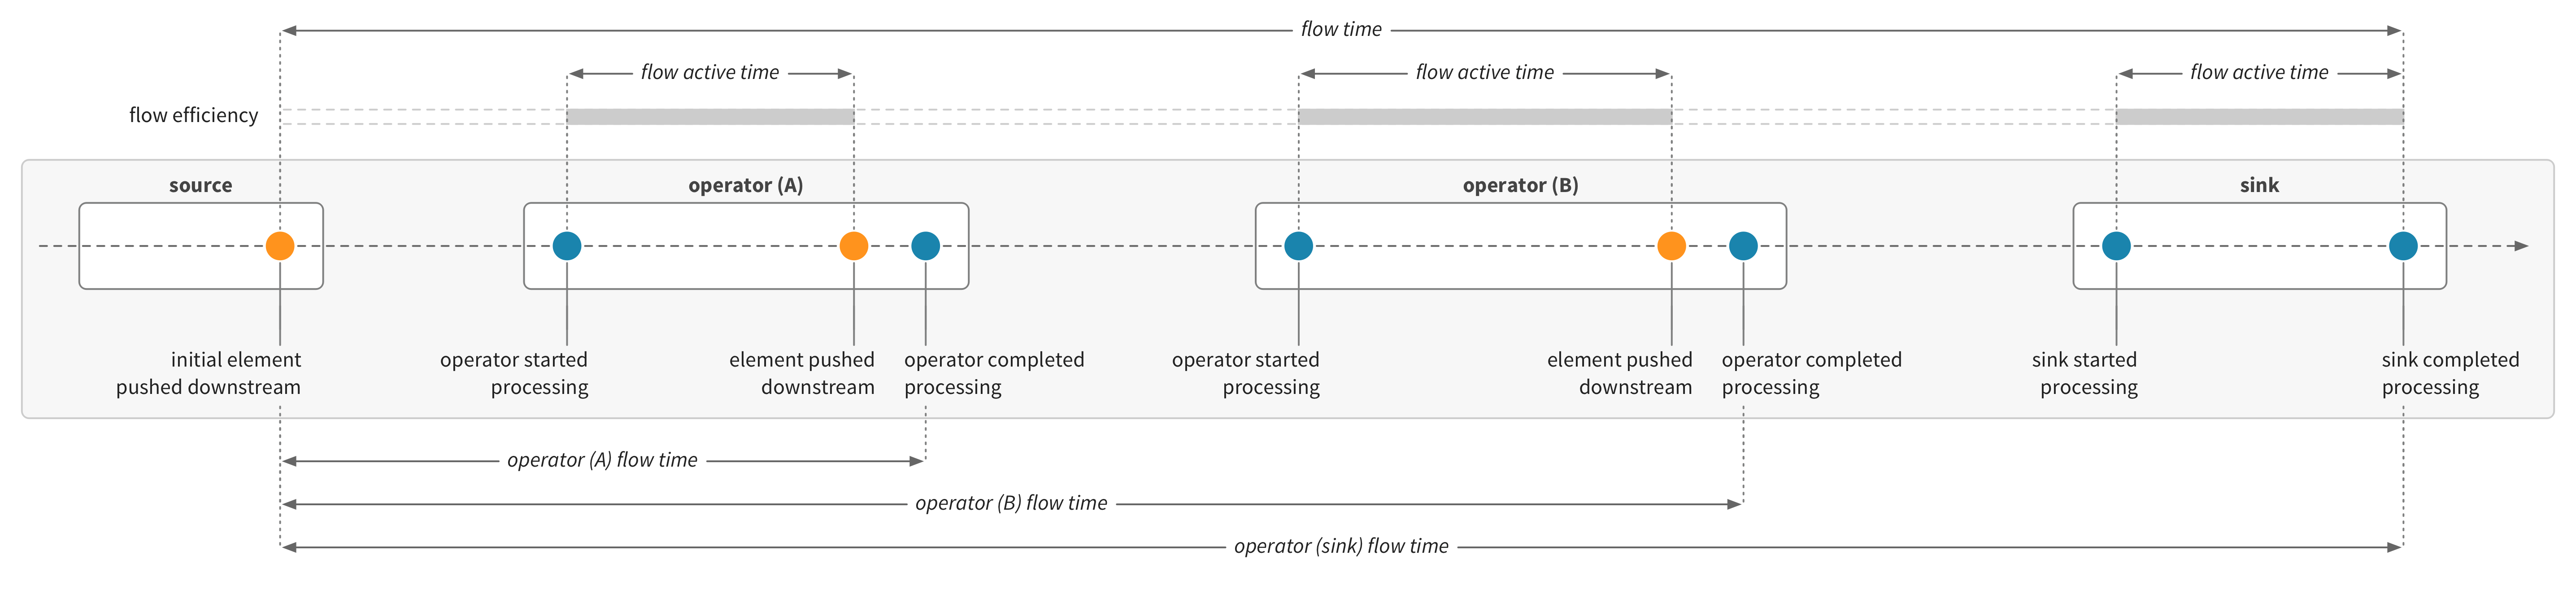
Extended metrics for streams include flow time—the time for elements to flow through the stream from sources to sinks. The flow time is recorded using a Stopwatch, which is started at the first push in the stream, propagated through the stream with the flow of elements, and then stopped when a sink has completed processing. The operator flow time metric records the current flow time after each operator has completed. Stopwatches can also record the active time during the flow—the time spent actively processing stream operators, as compared with waiting. A flow efficiency metric can be derived from the active time—measuring how much of the total flow time is active. The per-flow metrics are not enabled by default and can be enabled for streams as needed.
Flow metrics are based on Stopwatch which is disabled by default, and needs to be enabled.
Flow metrics for streams are illustrated in this diagram:
To enable flow metrics using configuration, use the flows setting:
cinnamon.akka {
streams {
"example.streams.a.*" {
report-by = name
flows = on
}
}
}To enable flow metrics using the Instrumented attribute, use the per-flow argument or method:
- Scala
-
import com.lightbend.cinnamon.akka.stream.CinnamonAttributes._ Source.single(0) .map(_ + 1) .to(Sink.ignore) .instrumented(name = "my-stream", perFlow = true) .run() - Java
-
Source.single(0) .merge(Source.single(1)) .to(Sink.ignore()) .addAttributes( CinnamonAttributes.isInstrumented() .withReportByName("my-stream") .withPerFlow() .attributes()) .run(materializer);
Demand metrics
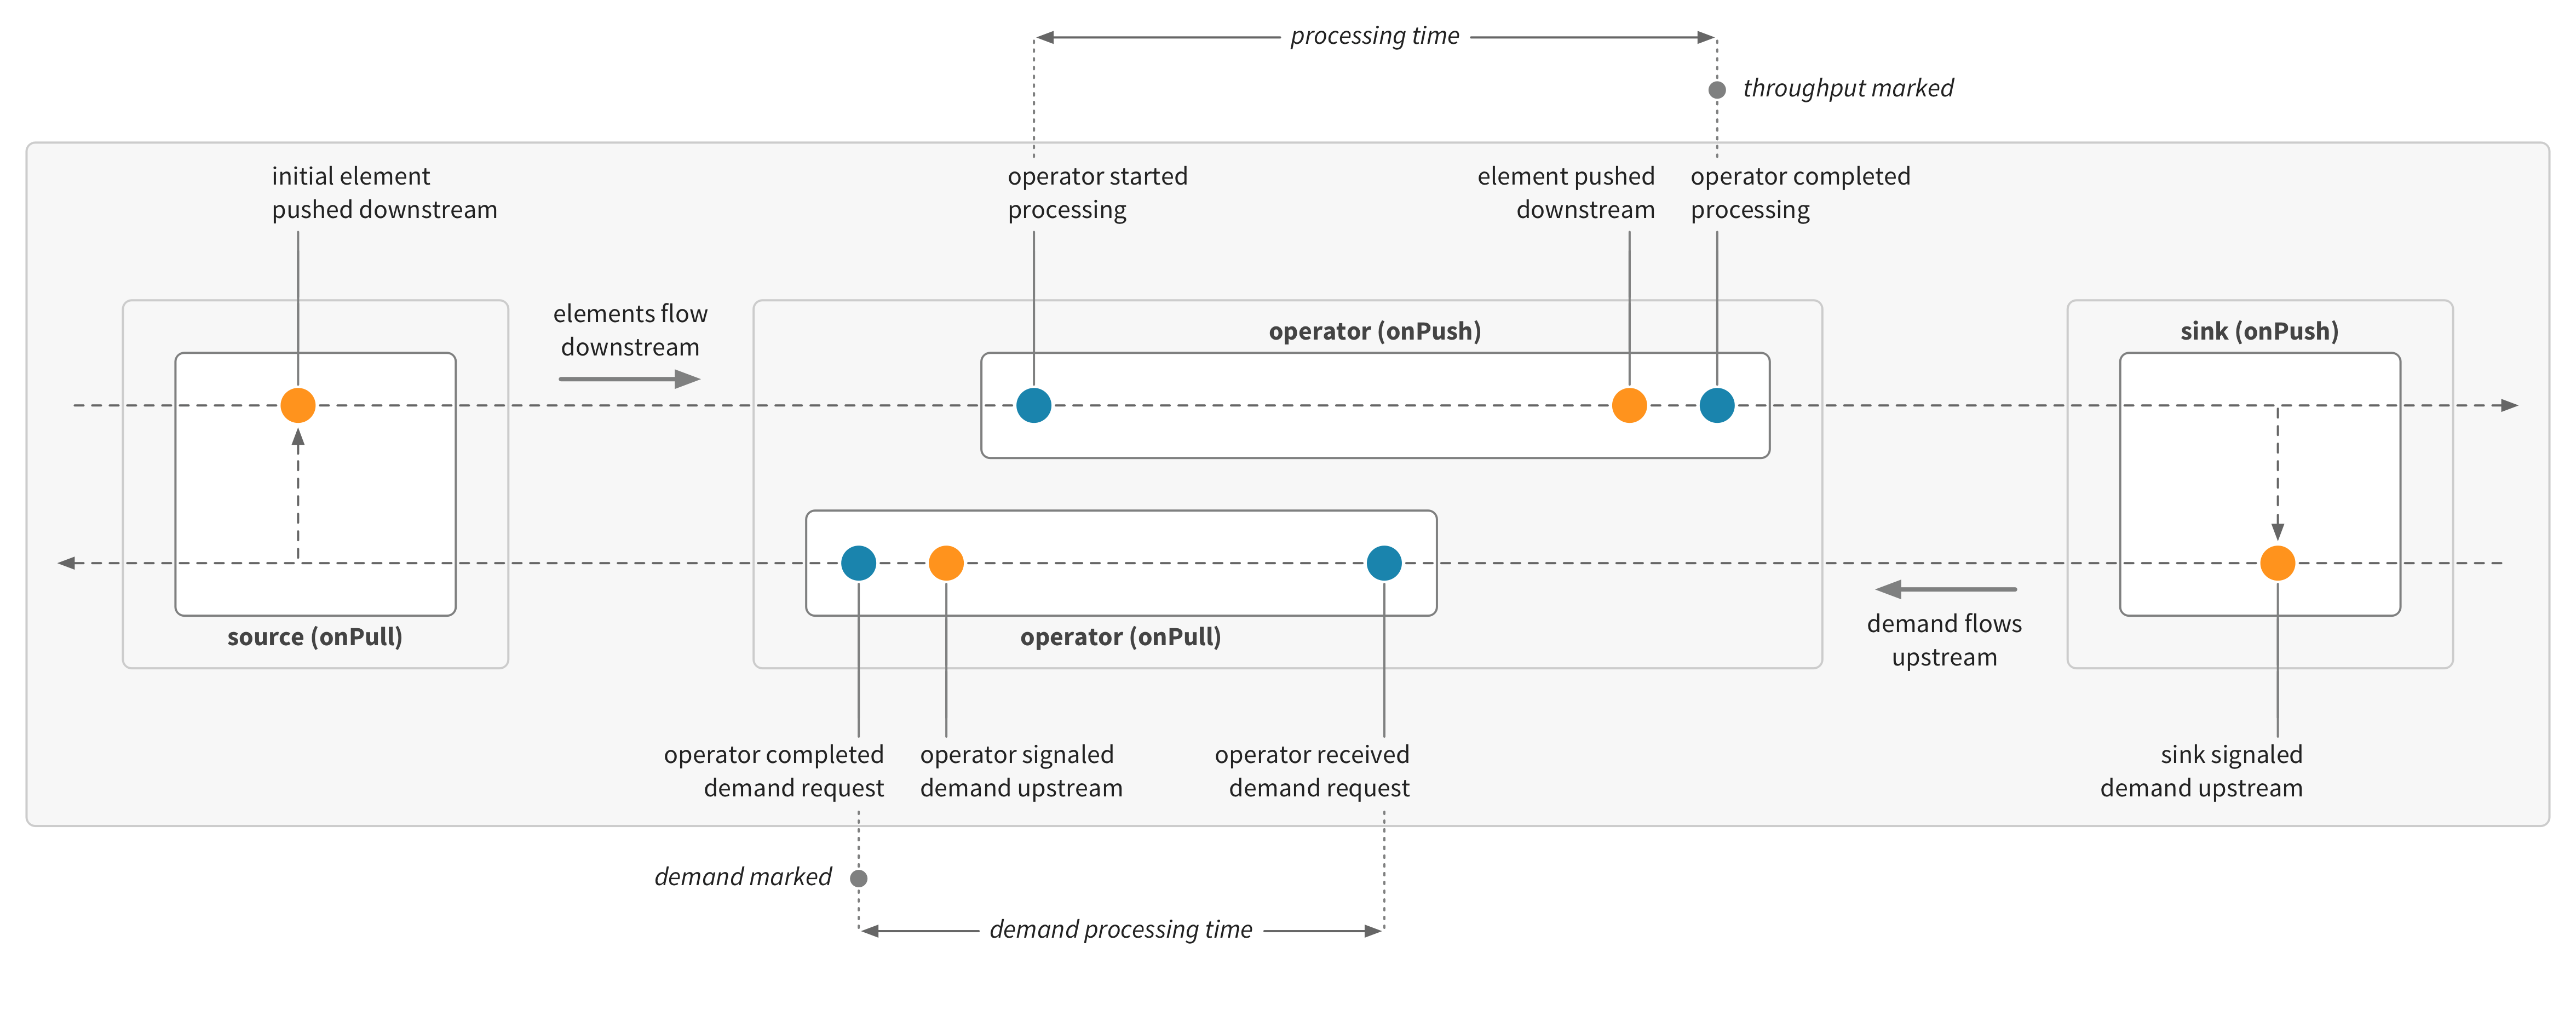
Akka Stream operators process flows in two directions: elements flow downstream, based on demand which flows upstream. The throughput and processing time metrics are for the processing of elements flowing downstream. Cinnamon can also record metrics for the demand flowing upstream. Demand metrics include demand (the rate of demand processed by an operator) and demand processing time (the time for processing demand requests). Demand metrics are useful for instrumenting sources, or operators which behave as sources, where the work is performed on pull in response to demand. Demand metrics are not enabled by default. If demand metrics are not enabled, then Cinnamon will automatically record demand metrics for stream sources as regular metrics (so rate of demand on a source will be recorded as throughput and demand processing time for a source will be recorded as processing time).
Throughput and processing time metrics for upstream demand are illustrated in this diagram:
Demand metrics for all operators can be enabled with the following configuration setting:
cinnamon.akka.stream.metrics {
demand = on
}Latency metrics
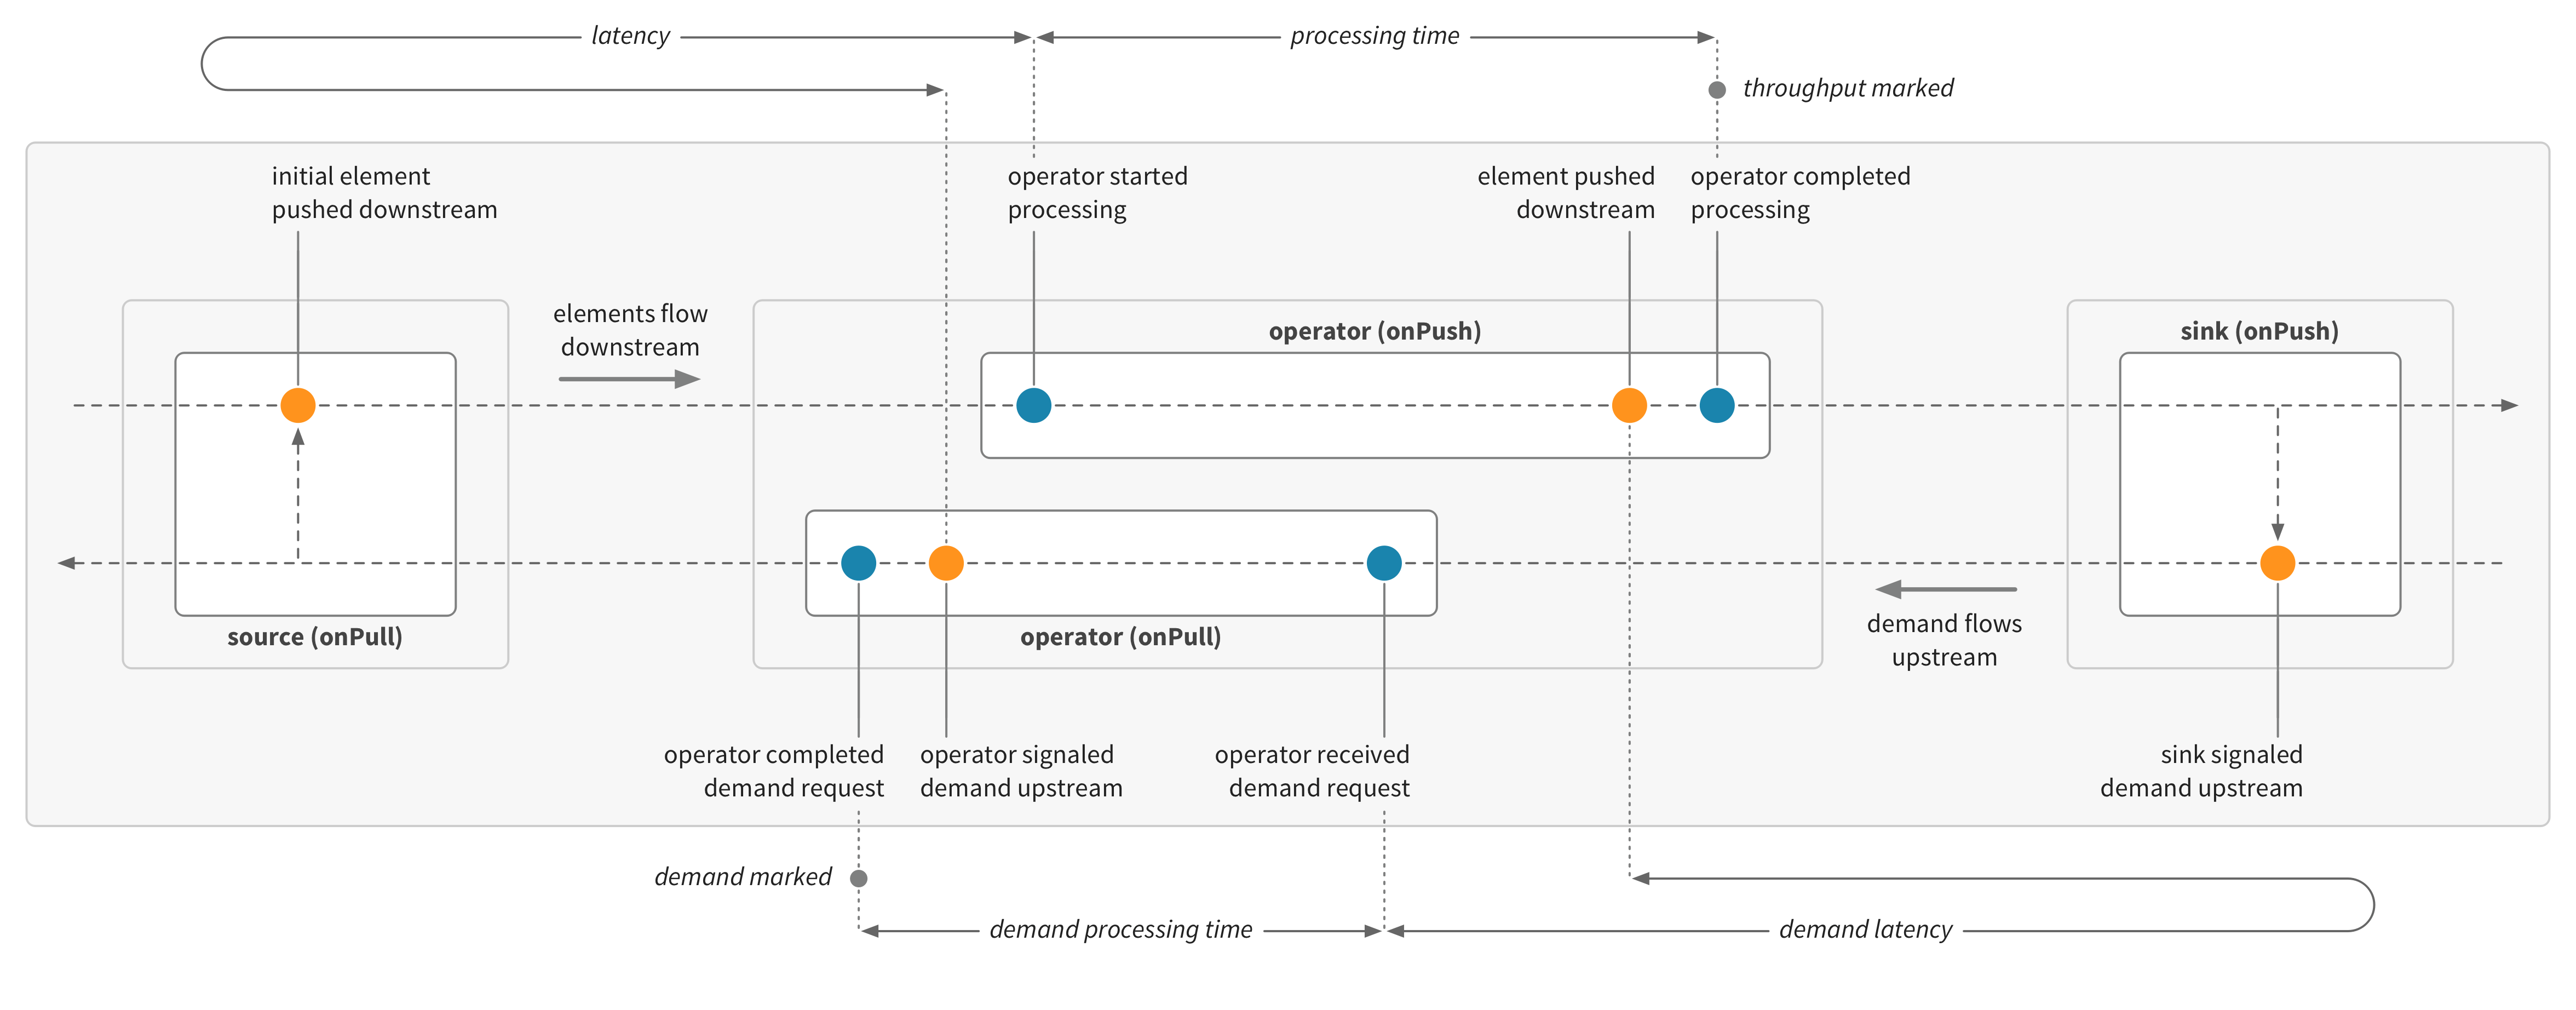
Cinnamon can record the latency (inactive time) for stream operators. Latency can be recorded for upstream or downstream of each operator. Latency metrics include latency (the time spent waiting for elements from upstream—the time from demanding an element upstream with a pull to starting to process an element from a push) and demand latency (the time spent waiting for demand from downstream—the time from providing an element downstream with a push to starting to process demand from a pull).
Latency metrics (alongside the processing metrics) are illustrated in this diagram:
Latency metrics are not enabled by default and can be enabled with the following configuration setting:
cinnamon.akka.stream.metrics {
latency = on
}Demand latency will only be recorded when both demand metrics and latency metrics are enabled.
Connection metrics
Metrics for stream operators include throughput (the rate of elements that have been processed by an operator) and processing time (the time for processing pushed elements). These metrics can also be enabled per-connection for operators with multiple inputs, where the throughput and processing time will be specific to the upstream operator.
To enable connection metrics using configuration, use the connections setting:
cinnamon.akka {
streams {
"example.streams.a.*" {
report-by = name
connections = on
}
}
}To enable connection metrics using the Instrumented attribute, use the per-connection argument or method:
- Scala
-
import com.lightbend.cinnamon.akka.stream.CinnamonAttributes._ Source.single(0) .merge(Source.single(1)) .to(Sink.ignore) .instrumented(name = "my-stream", perConnection = true) .run() - Java
-
Source.single(0) .merge(Source.single(1)) .to(Sink.ignore()) .addAttributes( CinnamonAttributes.isInstrumented() .withReportByName("my-stream") .withPerConnection() .attributes()) .run(materializer);
Boundary metrics
Asynchronous islands within a stream are connected over boundaries rather than connections, and throughput and processing time metrics can be enabled for the events flowing through these internal boundaries — this can be used for creating connection graphs from the stream metrics, along with the connection metrics.
To enable boundary metrics using configuration, use the boundaries setting:
cinnamon.akka {
streams {
"example.streams.a.*" {
report-by = name
boundaries = on
}
}
}To enable boundary metrics using the Instrumented attribute, use the per-boundary argument or method:
- Scala
-
import com.lightbend.cinnamon.akka.stream.CinnamonAttributes._ Source.single(0) .merge(Source.single(1)) .to(Sink.ignore) .instrumented(name = "my-stream", perBoundary = true) .run() - Java
-
Source.single(0) .merge(Source.single(1)) .to(Sink.ignore()) .addAttributes( CinnamonAttributes.isInstrumented() .withReportByName("my-stream") .withPerBoundary() .attributes()) .run(materializer);
Grafana dashboard
The Cinnamon developer sandbox includes an additional dashboard for the extended telemetry for Akka Streams.