SLF4J events
This backend allows you to log events, e.g. actor events, and cluster events. The implementation uses SLF4J and is, therefore, not tied to any specific logging implementation.
Extra details for events (such as the actor associated with an event) are added to the MDC so that the log message layout can be configured or appenders can represent the MDC as structured data.
The Cinnamon SLF4J events logger name is CinnamonSlf4jEvents and the log level to enable is INFO.
Cinnamon dependency
First make sure that your build is configured to use the Cinnamon Agent.
Next add the SLF4J event backend dependency to your build:
- sbt
-
libraryDependencies += Cinnamon.library.cinnamonSlf4jEvents - Maven
-
<dependency> <groupId>com.lightbend.cinnamon</groupId> <artifactId>cinnamon-slf4j-events</artifactId> <version>2.20.3</version> </dependency> - Gradle
-
dependencies { implementation group: 'com.lightbend.cinnamon', name: 'cinnamon-slf4j-events', version: '2.20.3' }
Cinnamon configuration
It is possible to configure whether the logged output be wrapped in quotes ("") or not. If enabled, all keys and values will be wrapped in quotes, e.g. "actor-system"="BottleneckSample". This feature is off by default but can be switched on via configuration:
cinnamon.logging {
slf4j-events {
use-quotes = true
}
}Example configuration for Console logging
This section describes how to get Console logging for Logback and Log4j2.
Logback
Logback dependencies
- sbt
-
libraryDependencies ++= Seq( "ch.qos.logback" % "logback-classic" % "1.2.13" ) - Maven
-
<dependency> <groupId>ch.qos.logback</groupId> <artifactId>logback-classic</artifactId> <version>1.2.13</version> </dependency> - Gradle
-
dependencies { implementation( [group: 'ch.qos.logback', name: 'logback-classic', version: '1.2.13'] ) }
Logback configuration
Add the following content to a file called logback.xml on the classpath of your application:
<?xml version="1.0" encoding="UTF-8"?>
<configuration>
<appender name="STDOUT" class="ch.qos.logback.core.ConsoleAppender">
<encoder>
<pattern>%-4relative [%thread] %-5level - %mdc%n</pattern>
</encoder>
</appender>
<root level="all">
<appender-ref ref="STDOUT" />
</root>
</configuration>Log4j2
Log4j2 dependencies
- sbt
-
libraryDependencies ++= Seq( "org.apache.logging.log4j" % "log4j-api" % "2.17.2", "org.apache.logging.log4j" % "log4j-core" % "2.17.2", "org.apache.logging.log4j" % "log4j-slf4j-impl" % "2.17.2" ) - Maven
-
<dependency> <groupId>org.apache.logging.log4j</groupId> <artifactId>log4j-api</artifactId> <version>2.17.2</version> </dependency> <dependency> <groupId>org.apache.logging.log4j</groupId> <artifactId>log4j-core</artifactId> <version>2.17.2</version> </dependency> <dependency> <groupId>org.apache.logging.log4j</groupId> <artifactId>log4j-slf4j-impl</artifactId> <version>2.17.2</version> </dependency> - Gradle
-
dependencies { implementation( [group: 'org.apache.logging.log4j', name: 'log4j-api', version: '2.17.2'], [group: 'org.apache.logging.log4j', name: 'log4j-core', version: '2.17.2'], [group: 'org.apache.logging.log4j', name: 'log4j-slf4j-impl', version: '2.17.2'] ) }
Log4j2 configuration
Add the following content to a file called log4j.xml on the classpath of your application:
<?xml version="1.0" encoding="UTF-8"?>
<Configuration status="INFO">
<Appenders>
<Console name="STDOUT" target="SYSTEM_OUT">
<PatternLayout pattern="%d{HH:mm:ss.SSS} [%t] %-5level %logger{36} - %X%n" />
</Console>
</Appenders>
<Loggers>
<Root level="debug">
<AppenderRef ref="STDOUT" />
</Root>
</Loggers>
</Configuration>Example: Logging events to Elasticsearch via Logstash
Elasticsearch is commonly used to store and search for events. One way to get logged events into Elasticsearch is to use Logstash.
In this example we will show how to use and configure Logback and Logstash to store events in Elasticsearch.
Cinnamon developer sandbox
The Cinnamon developer sandbox is a convenient way to run all the required tools (Logstash, Kibana, and Elasticsearch) for this demo. Follow the instructions to get this up and running.
Logstash
Logstash dependencies
Make sure that you already have the base Logback dependencies configured. To encode the logged output into JSON and push it to Logstash this example uses the open-source library logstash-logback-encoder. Add the following dependency to your project:
- sbt
-
libraryDependencies += "net.logstash.logback" % "logstash-logback-encoder" % "4.11" - Maven
-
<dependency> <groupId>net.logstash.logback</groupId> <artifactId>logstash-logback-encoder</artifactId> <version>4.11</version> </dependency> - Gradle
-
dependencies { implementation group: 'net.logstash.logback', name: 'logstash-logback-encoder', version: '4.11' }
Logstash configuration
The Docker Logstash container in the Cinnamon developer sandbox runs on port 5000, so the Logback configuration file here below uses this port. Add the following to a logback.xml file and make sure to adjust to the settings of your environment.
<?xml version="1.0" encoding="UTF-8"?>
<configuration>
<appender name="stash" class="net.logstash.logback.appender.LogstashSocketAppender">
<host>127.0.0.1</host>
<port>5000</port>
</appender>
<root level="all">
<appender-ref ref="stash" />
</root>
</configuration>Running
Make sure that Logstash, Elasticsearch, and Kibana is running. If you are using Docker you should see something like this:
> docker ps

CONTAINER ID        IMAGE                                                 COMMAND                  CREATED             STATUS              PORTS                                                                NAMES
da5a544dd0de        docker.elastic.co/logstash/logstash:5.6.3             "/usr/local/bin/dock…"   2 hours ago         Up 56 seconds       5044/tcp, 0.0.0.0:5000->5000/udp, 9600/tcp, 0.0.0.0:7000->7000/tcp   cinnamondockersandbox272_logstash_1
c0d15b8e165c        docker.elastic.co/kibana/kibana:5.6.3                 "/bin/sh -c /usr/loc…"   2 hours ago         Up 56 seconds       0.0.0.0:5601->5601/tcp                                               cinnamondockersandbox272_kibana_1
009eae94b8a1        grafana/grafana:4.6.1                                 "/run.sh"                2 hours ago         Up 56 seconds       0.0.0.0:3000->3000/tcp                                               cinnamondockersandbox272_grafana_1
343eda465437        docker.elastic.co/elasticsearch/elasticsearch:5.6.3   "/bin/bash bin/es-do…"   2 hours ago         Up 57 seconds       0.0.0.0:9200->9200/tcp, 9300/tcp                                     cinnamondockersandbox272_elasticsearch_1
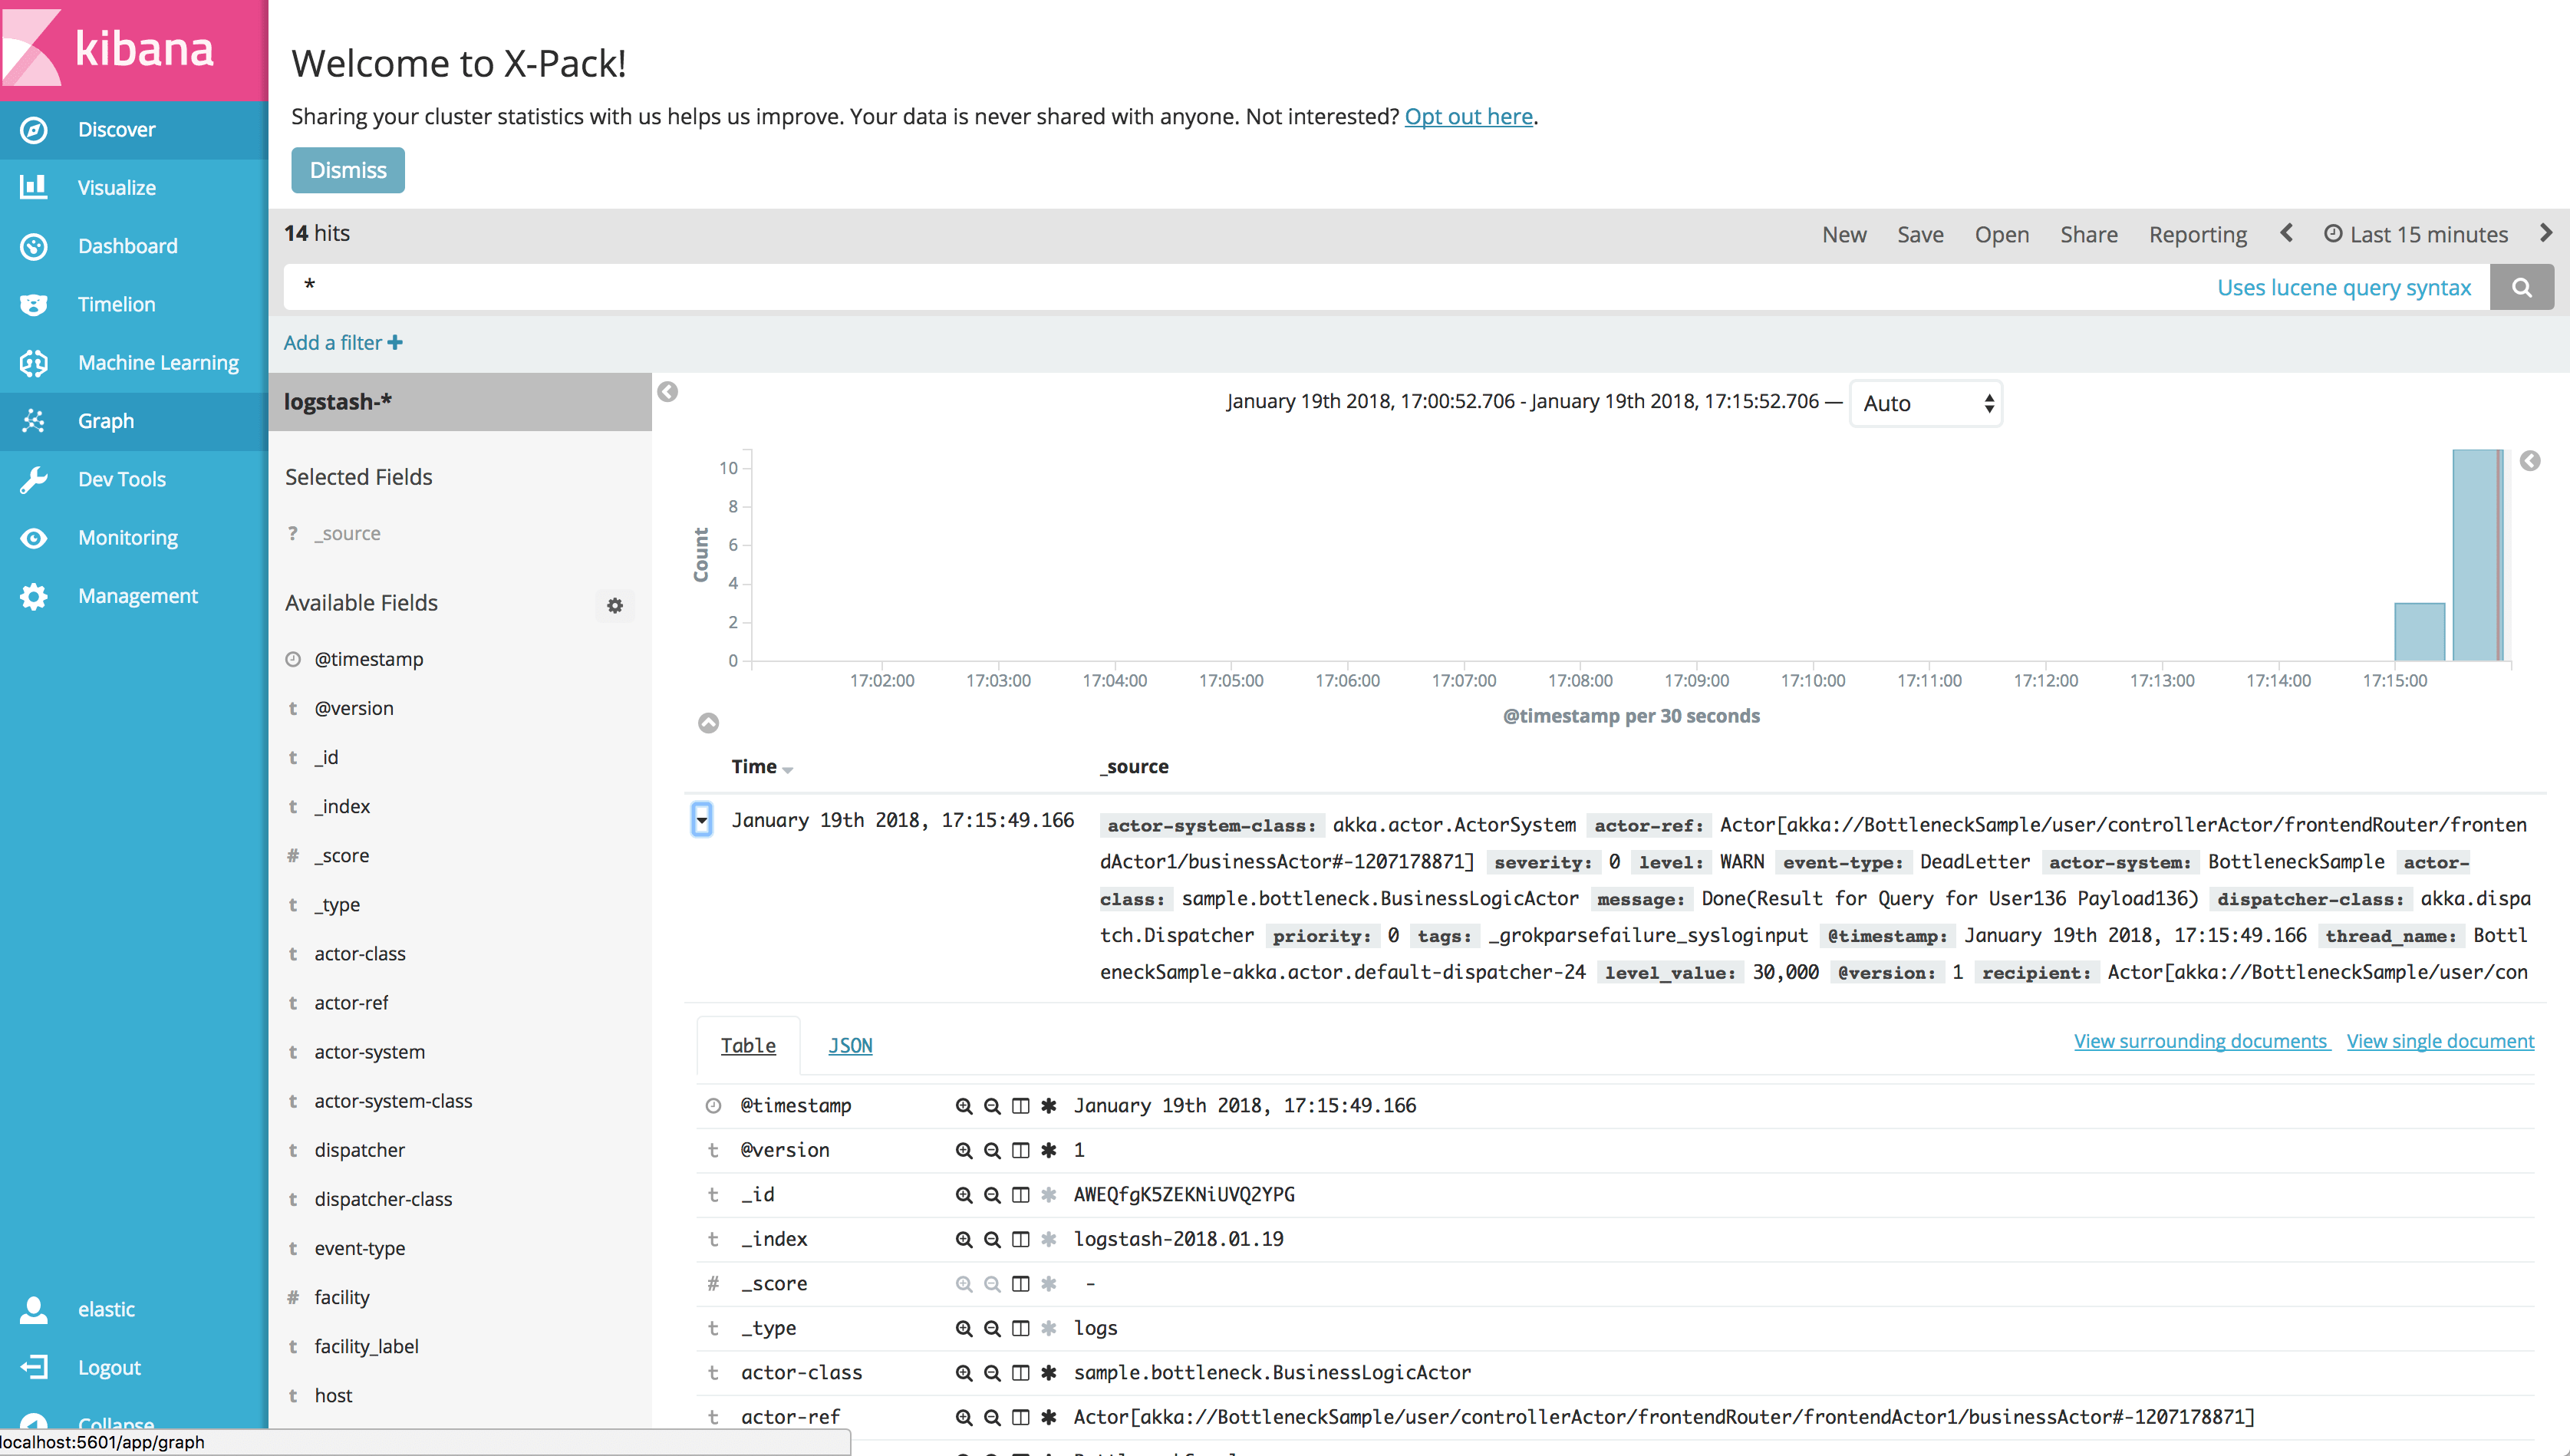
Next, run your application with the dependencies and configuration set according to above. Logging in to Kibana, it should be possible to find events data using the logstash-* index: