Prometheus developer sandbox
Developer sandbox components
This developer sandbox uses Prometheus, and Grafana for metric dashboards including example Grafana dashboards for many of the Cinnamon metrics. The following sections contain information about how to configure, run, and explore the sandbox.
Download Prometheus developer sandbox
First download Prometheus developer sandbox and unzip the developer sandbox scripts. You can do this in a terminal with:
curl -O https://downloads.lightbend.com/cinnamon/sandbox/cinnamon-prometheus-docker-sandbox-2.20.3.zip
unzip cinnamon-prometheus-docker-sandbox-2.20.3.zip
The unzipped directory contains a Docker Compose file, to download and run the Docker containers for the developer sandbox, and a Grafana plugin with dashboards for Cinnamon metrics.
Run your application with Prometheus
Add the Cinnamon dependencies to your application:
- sbt
-
libraryDependencies ++= Seq( Cinnamon.library.cinnamonPrometheus, Cinnamon.library.cinnamonPrometheusHttpServer ) - Maven
-
<dependency> <groupId>com.lightbend.cinnamon</groupId> <artifactId>cinnamon-prometheus</artifactId> <version>2.20.3</version> </dependency> <dependency> <groupId>com.lightbend.cinnamon</groupId> <artifactId>cinnamon-prometheus-httpserver</artifactId> <version>2.20.3</version> </dependency> - Gradle
-
implementation group: 'com.lightbend.cinnamon', name: 'cinnamon-prometheus', version: '2.20.3' implementation group: 'com.lightbend.cinnamon', name: 'cinnamon-prometheus-httpserver', version: '2.20.3'
Run your application, configured with a Prometheus HTTP exporter.
- application.conf
-
cinnamon.prometheus { exporters += http-server }
Prometheus is configured to scrape from the default HTTP exporter port. You can modify the Prometheus configuration in prometheus/prometheus.yml if needed.
Start Prometheus developer sandbox
To run the Prometheus Docker developer sandbox, first change into the unzipped directory at a terminal:
cd cinnamon-prometheus-docker-sandbox-2.20.3
Docker
Make sure that [Docker] is running and then start the developer sandbox using [Docker Compose]:
docker compose up
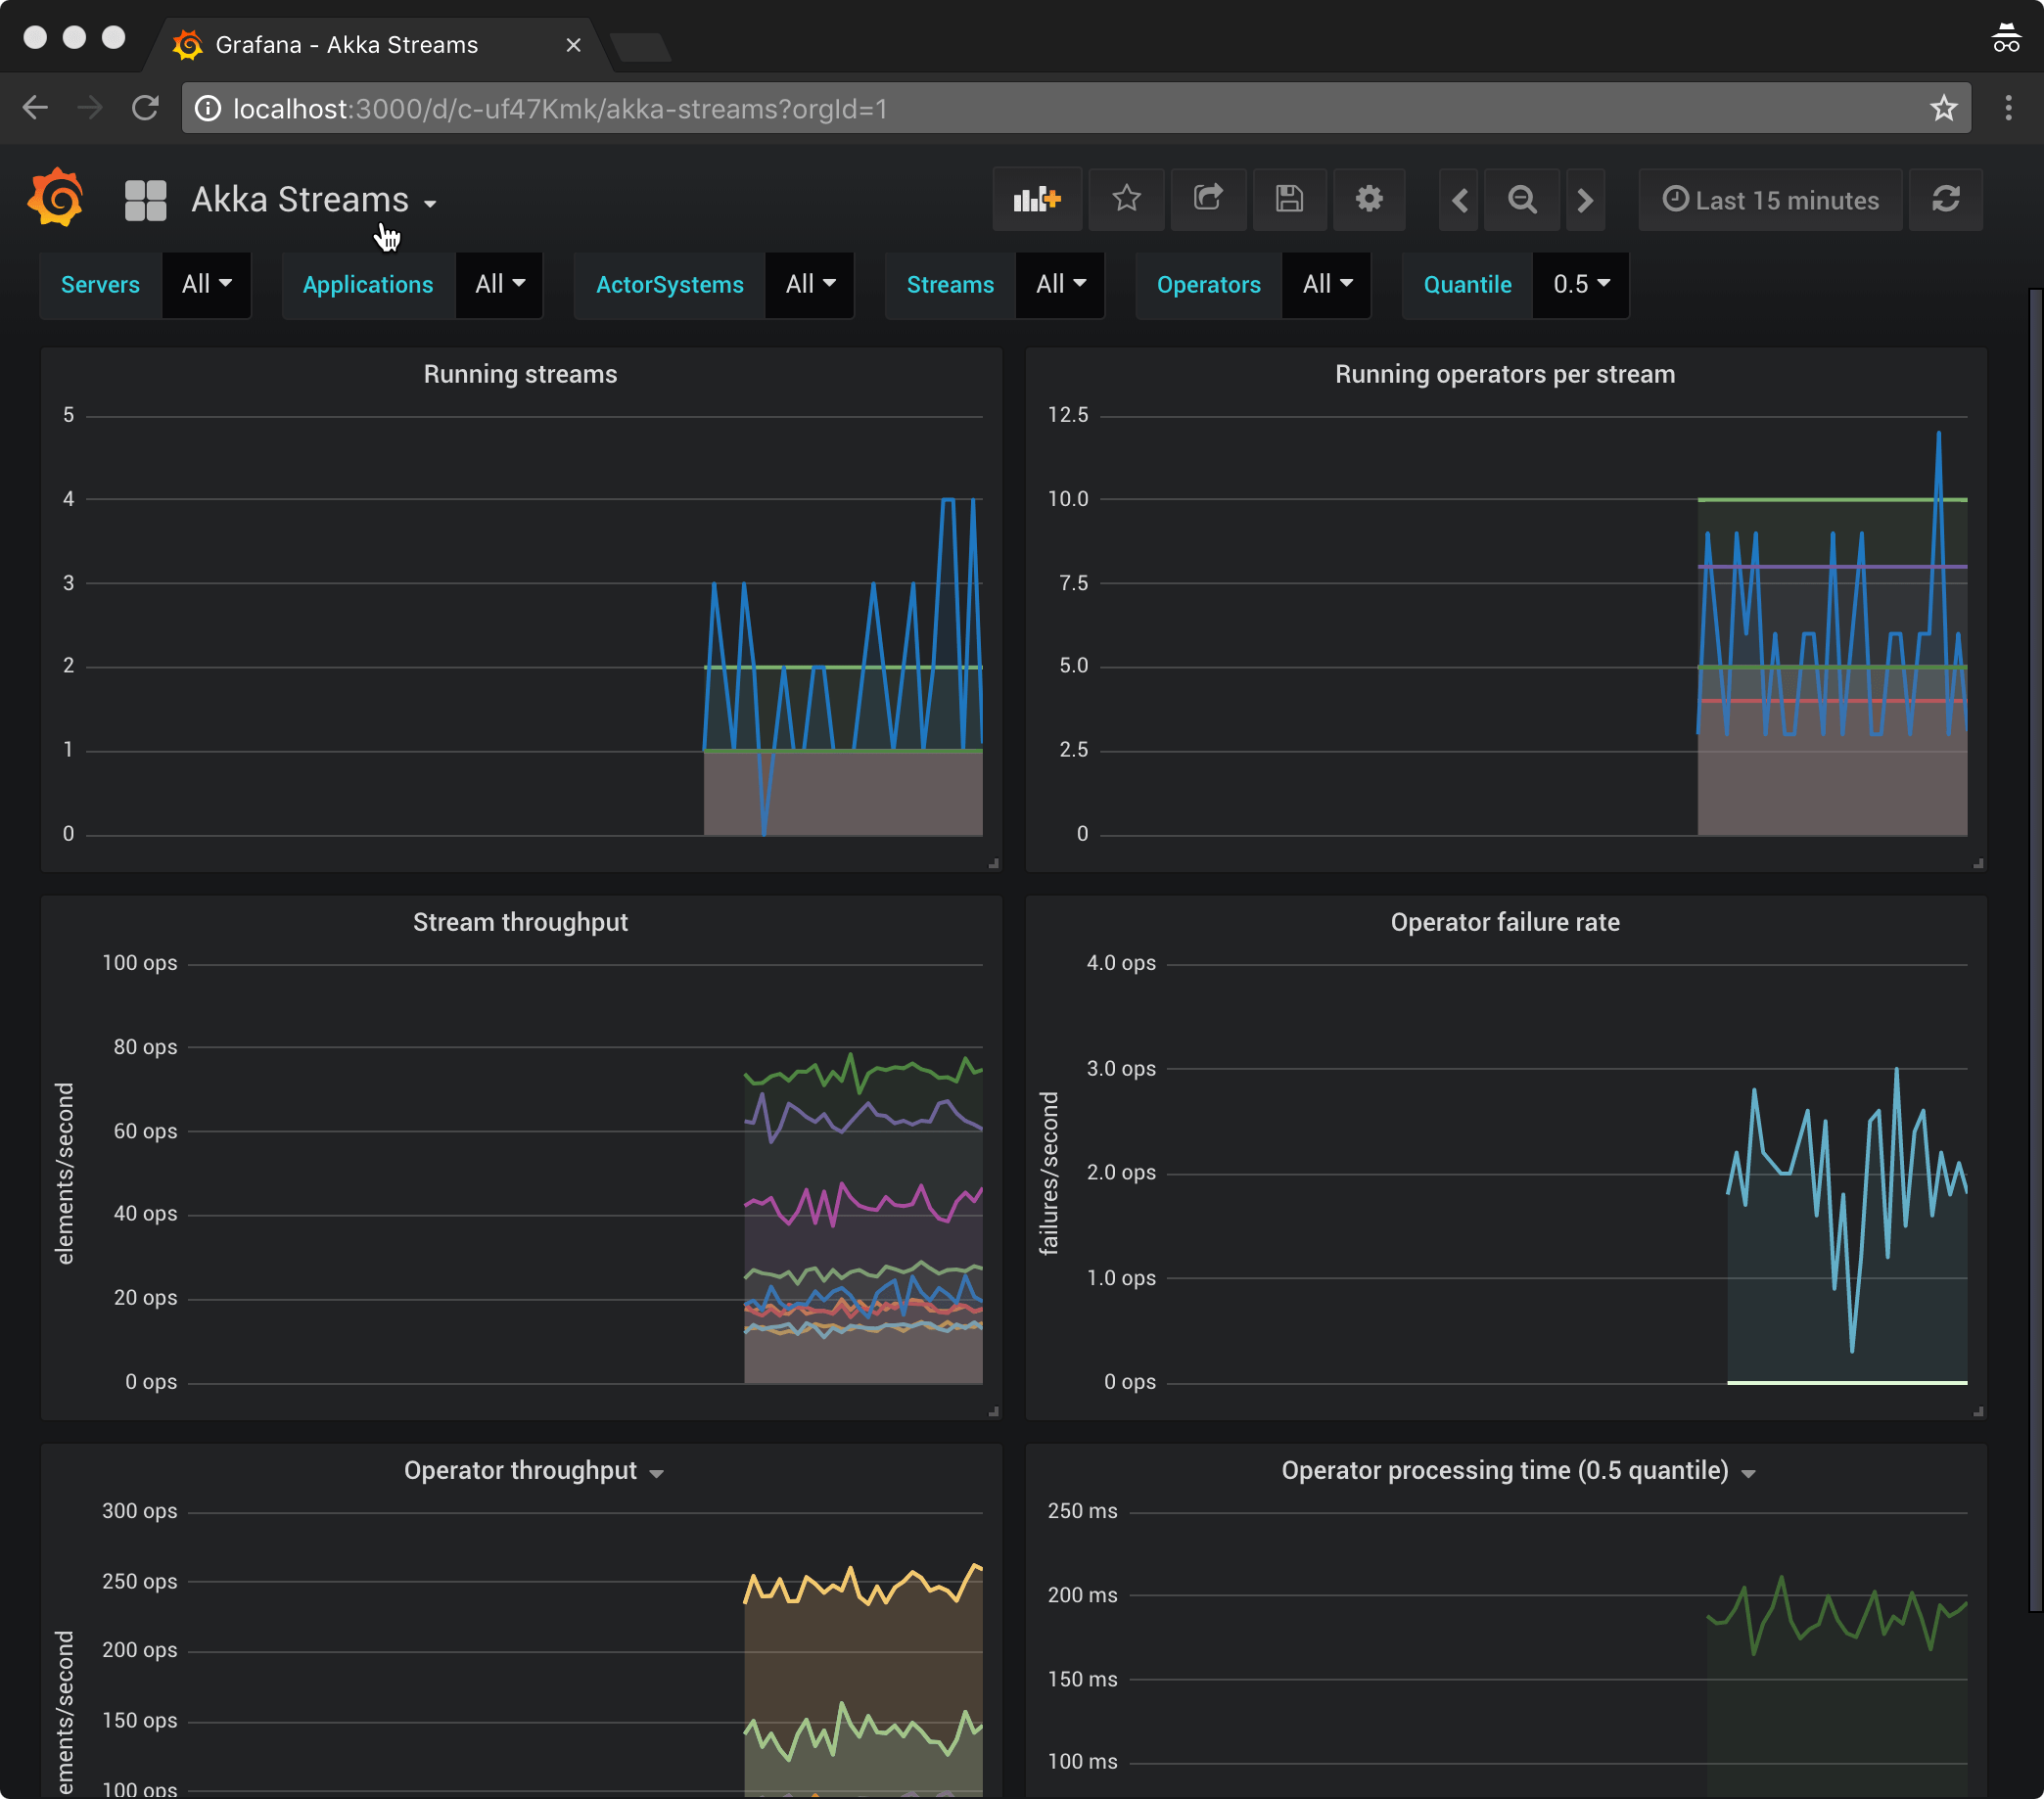
Explore in Grafana
The developer sandbox version of Grafana is available at http://localhost:3000.
You can then view the dashboards, which will begin displaying data from your application:
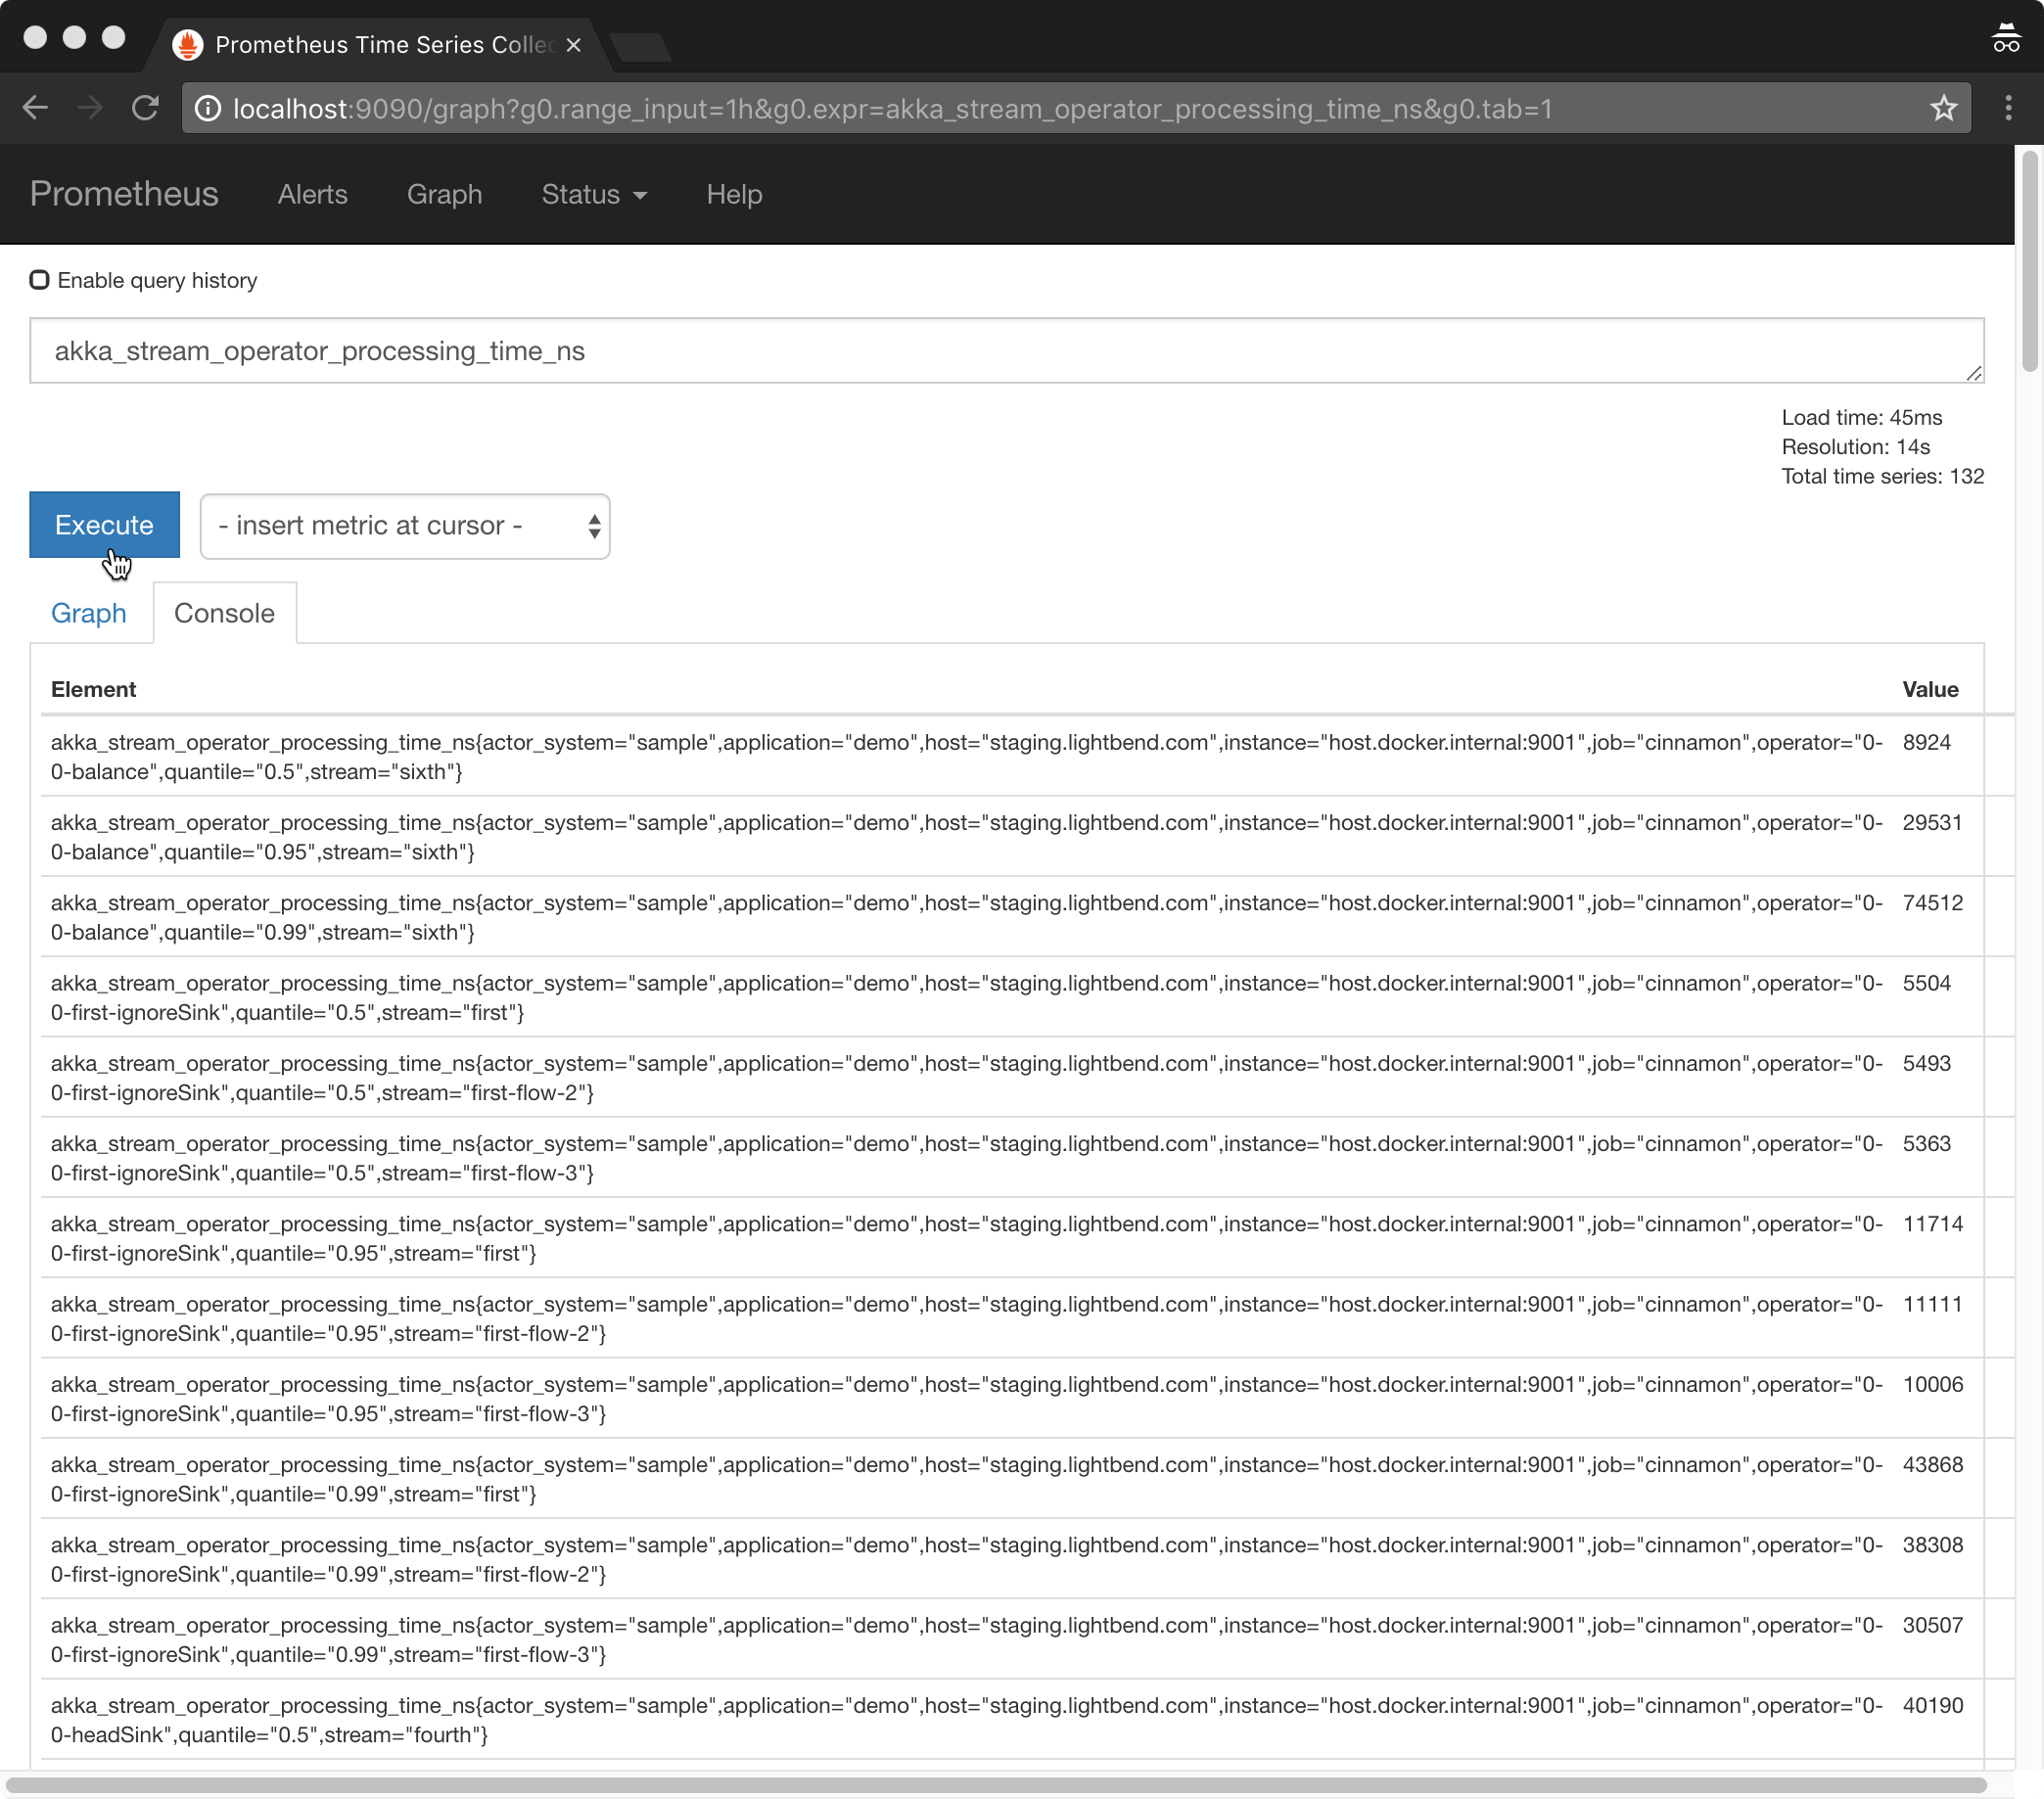
Explore in Prometheus
The Prometheus server is available at http://localhost:9090.
The Prometheus expression browser can be used to explore the recorded metrics directly: