Elasticsearch developer sandbox
Developer sandbox components
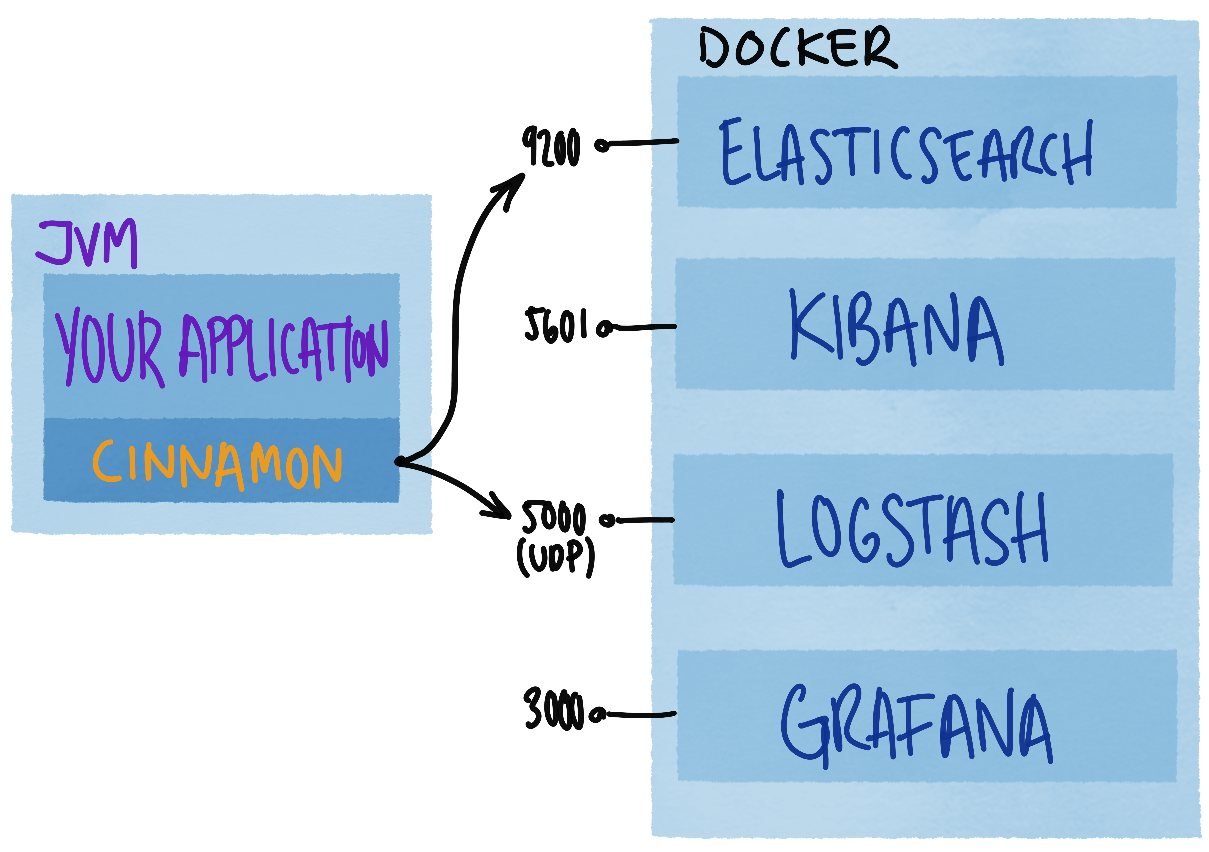
This developer sandbox uses Elasticsearch as a time-series and events database, Logstash for log forwarding, Kibana for event querying, and Grafana for metric dashboards. The following sections contain information about how to configure, run, and explore the sandbox.
Download developer sandbox
First download Elasticsearch developer sandbox and unzip the developer sandbox scripts. You can do this in a terminal with:
curl -O https://downloads.lightbend.com/cinnamon/sandbox/cinnamon-elasticsearch-docker-sandbox-2.20.3.zip
unzip cinnamon-elasticsearch-docker-sandbox-2.20.3.zip
The unzipped directory contains a Docker Compose file, to download and run the Docker containers for the developer sandbox, and a Grafana plugin with dashboards for Cinnamon metrics.
Run your application with Elasticsearch
Add the Cinnamon dependencies to your application:
- sbt
-
libraryDependencies ++= Seq( Cinnamon.library.cinnamonCHMetrics, Cinnamon.library.cinnamonCHMetricsElasticsearchReporter, Cinnamon.library.cinnamonSlf4jEvents ) - Maven
-
<dependency> <groupId>com.lightbend.cinnamon</groupId> <artifactId>cinnamon-chmetrics</artifactId> <version>2.20.3</version> </dependency> <dependency> <groupId>com.lightbend.cinnamon</groupId> <artifactId>cinnamon-chmetrics-elasticsearch-reporter</artifactId> <version>2.20.3</version> </dependency> <dependency> <groupId>com.lightbend.cinnamon</groupId> <artifactId>cinnamon-slf4j-events</artifactId> <version>2.20.3</version> </dependency> - Gradle
-
implementation group: 'com.lightbend.cinnamon', name: 'cinnamon-chmetrics', version: '2.20.3' implementation group: 'com.lightbend.cinnamon', name: 'cinnamon-chmetrics-elasticsearch-reporter', version: '2.20.3' implementation group: 'com.lightbend.cinnamon', name: 'cinnamon-slf4j-events', version: '2.20.3'
Please follow SLF4J events guidance to configure the application to log events to Elasticsearch via the sandbox’s Logstash.
Run your application, configured with a Elasticsearch Reporter.
- application.conf
-
cinnamon.chmetrics { reporters += elasticsearch-reporter elasticsearch-reporter { hosts = ["http://localhost:9200"] basic-auth { username = "elastic" password = "changeme" } frequency = 10s } }
Run developer sandbox
To run Lightbend Telemetry with the Docker developer sandbox, first change into the unzipped directory for the downloaded developer sandbox scripts at a terminal:
cd cinnamon-elasticsearch-docker-sandbox-2.20.3
Make sure that Docker is running, and then start the developer sandbox using Docker Compose:
docker compose up
This will start Docker containers for Elasticsearch, Kibana, and Grafana.
Or to run in the background, you can use detached mode:
docker compose up -d
Stop developer sandbox
To stop the developer sandbox, you can Ctrl+C if running in the foreground, or by using:
docker compose down
Explore
After developer sandbox and your application have been started the next thing is to look at the collected data. The developer sandbox environment provides two ways to explore the data: Grafana for metrics/event metrics and Kibana for events. Yes, it is also possible to look at individual metric records with Kibana, but since they make more sense when added together Grafana is a better option for metrics exploration.
Grafana
The developer sandbox version of Grafana is started on http://localhost:3000.
Explore dashboards
You can then view the dashboards, which will begin displaying data from your application:
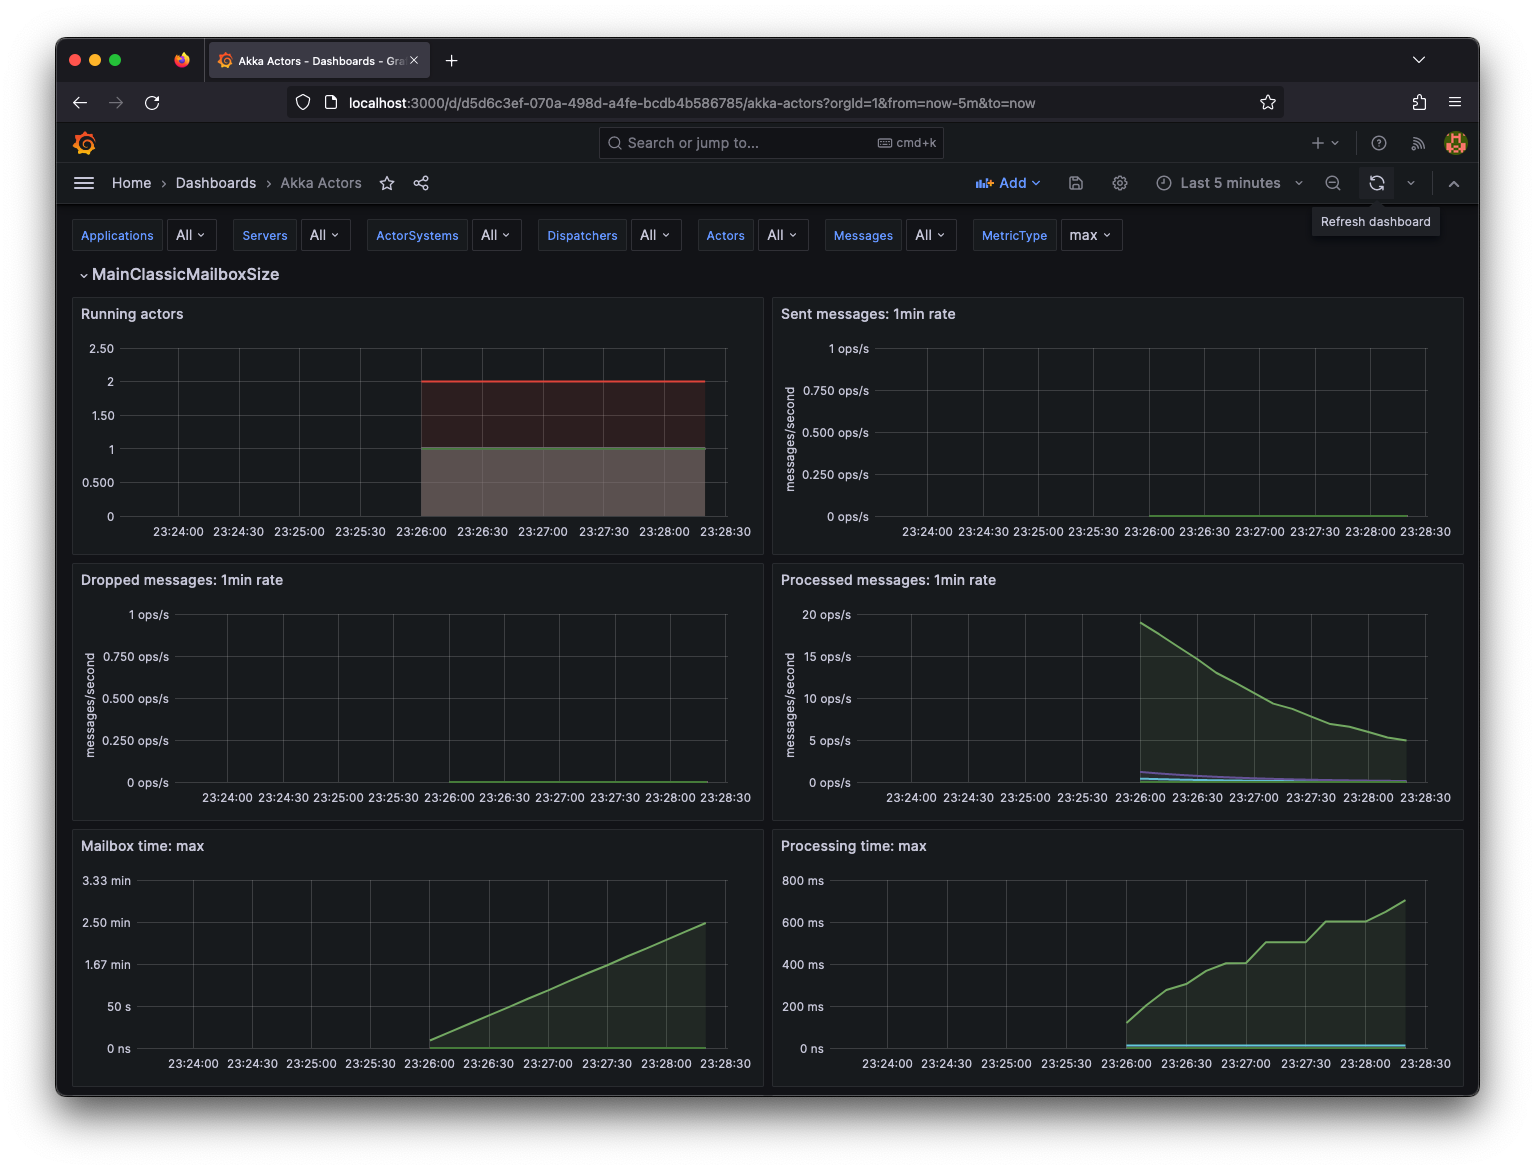
The Cinnamon Elasticsearch plugin contains these dashboards:
- Akka Actors
- Akka Dispatchers
- Akka Events
- Akka HTTP Clients
- Akka HTTP Endpoints
- Akka HTTP Servers
- Akka Remote Actors
- Akka Remote Nodes
- Akka Routers
- JVM Metrics
- Stopwatch Metrics
For more information about the dashboards see Grafana dashboards.
Kibana
The developer sandbox version of Kibana is started on http://localhost:5601.
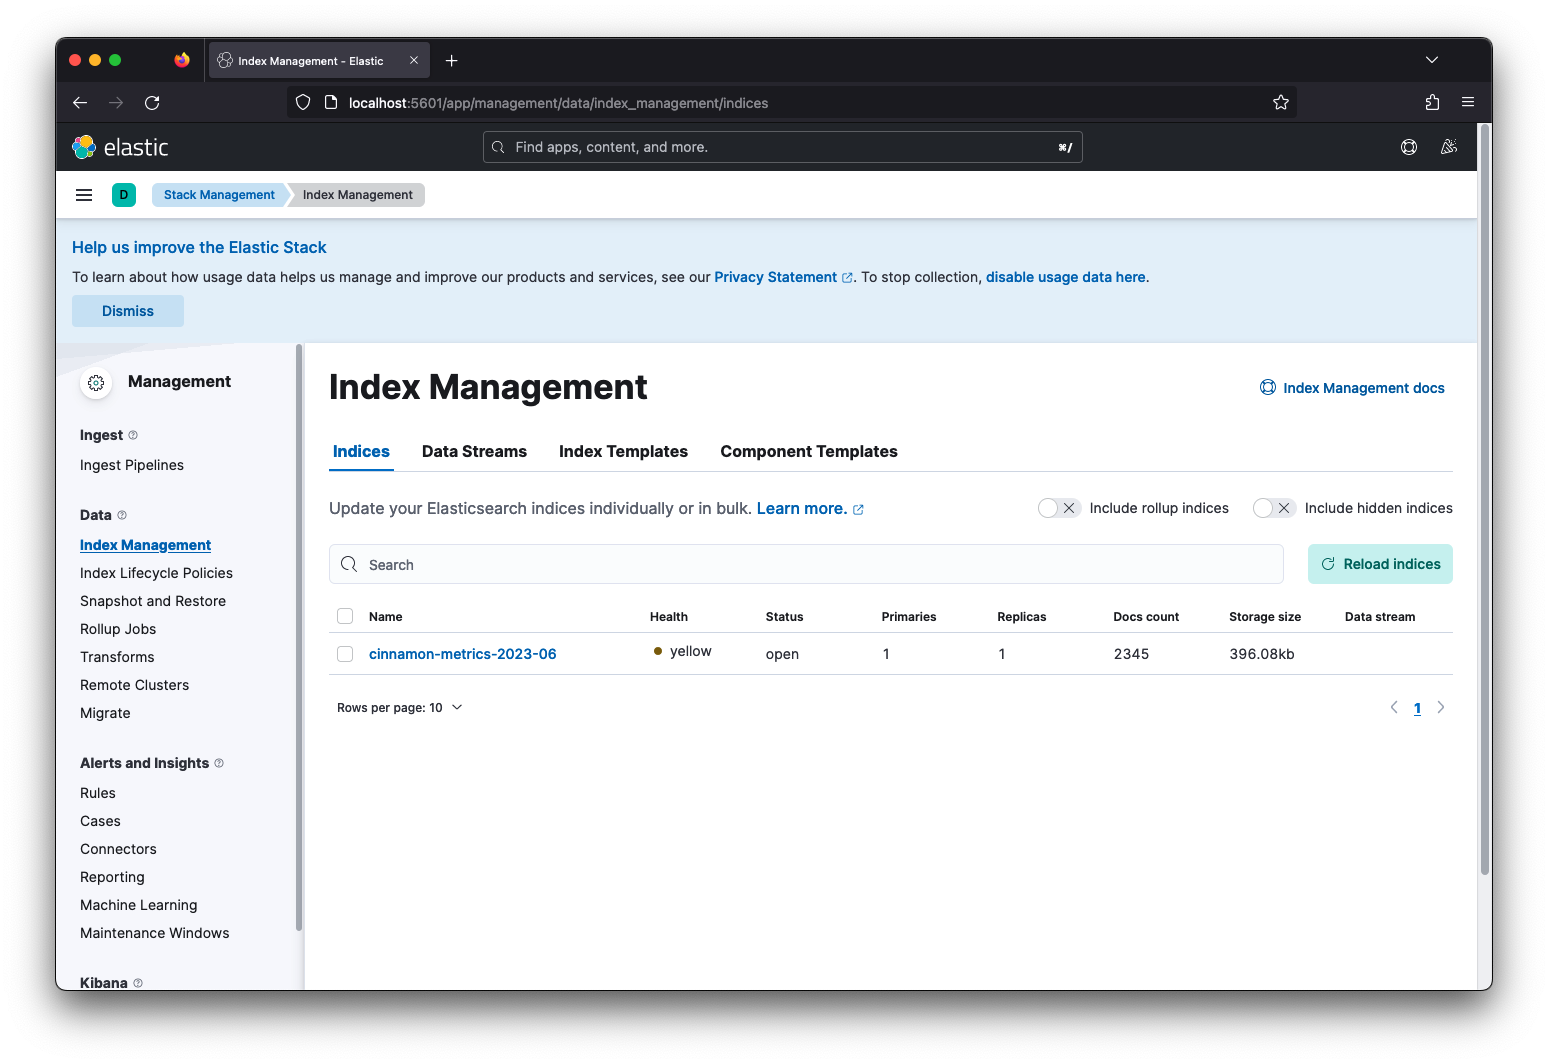
Create index
The index will be created automatically once your application is running. Verify that the index was created under Management > Stack Management > Index Management:
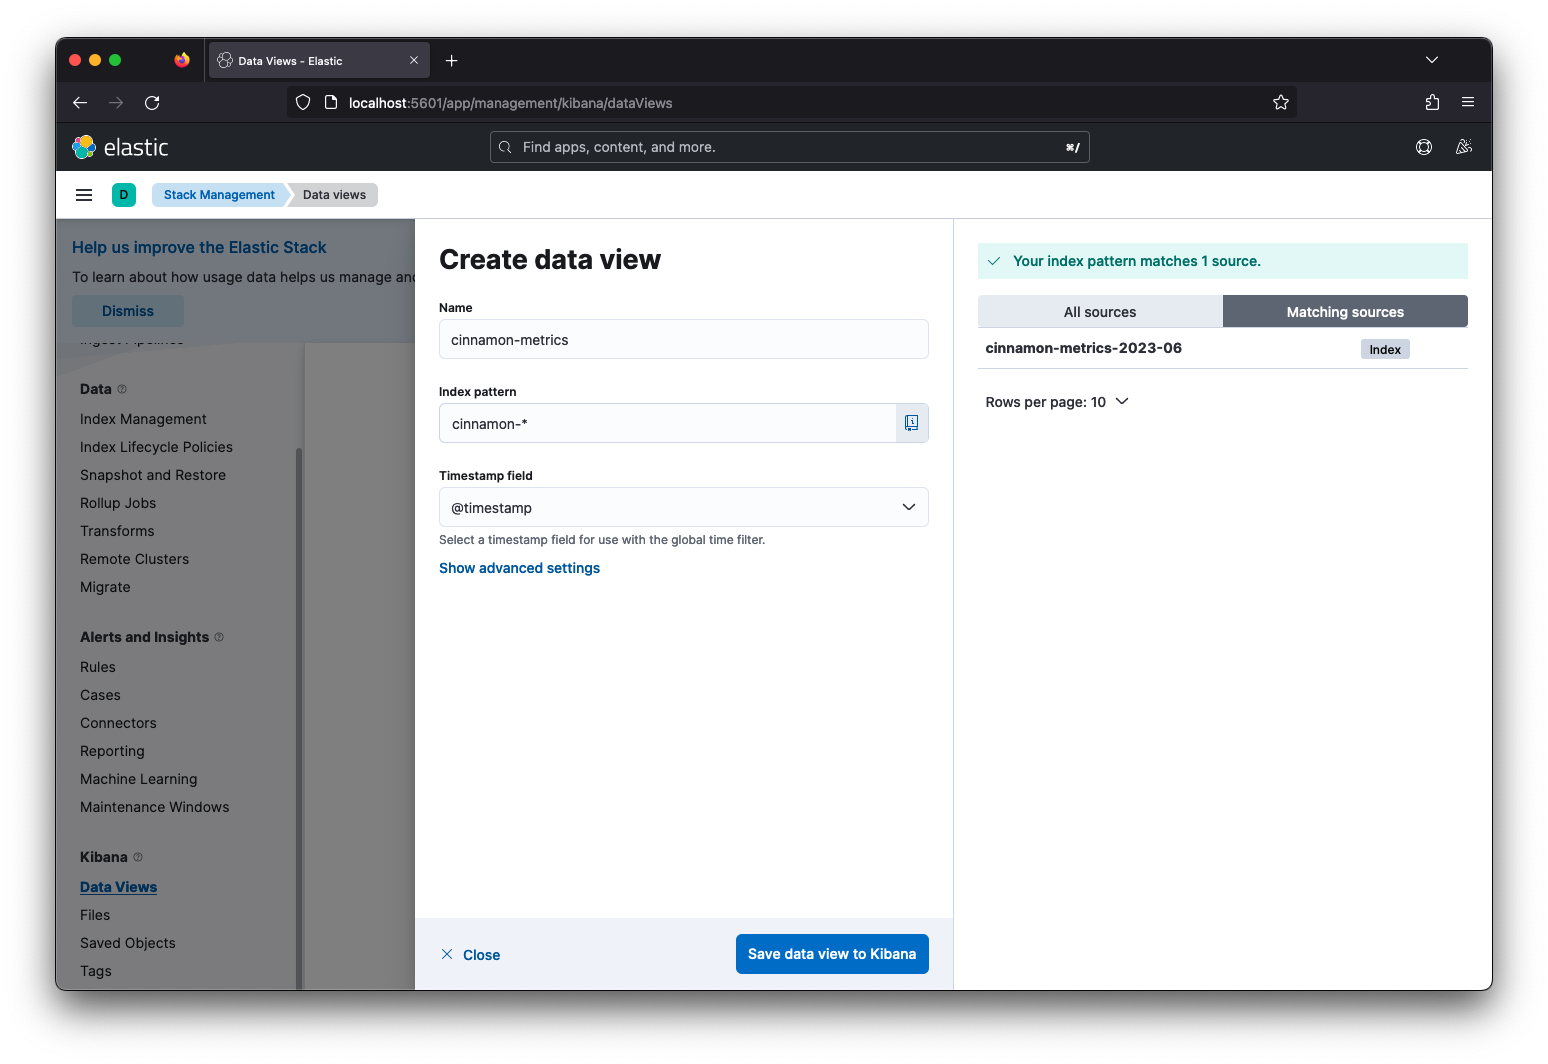
Create a Data View by choosing the available index and a corresponding name:
Explore data
To explore the data in Kibana you click on the Analytics > Discover tab and select a specific index, e.g. cinnamon-events:
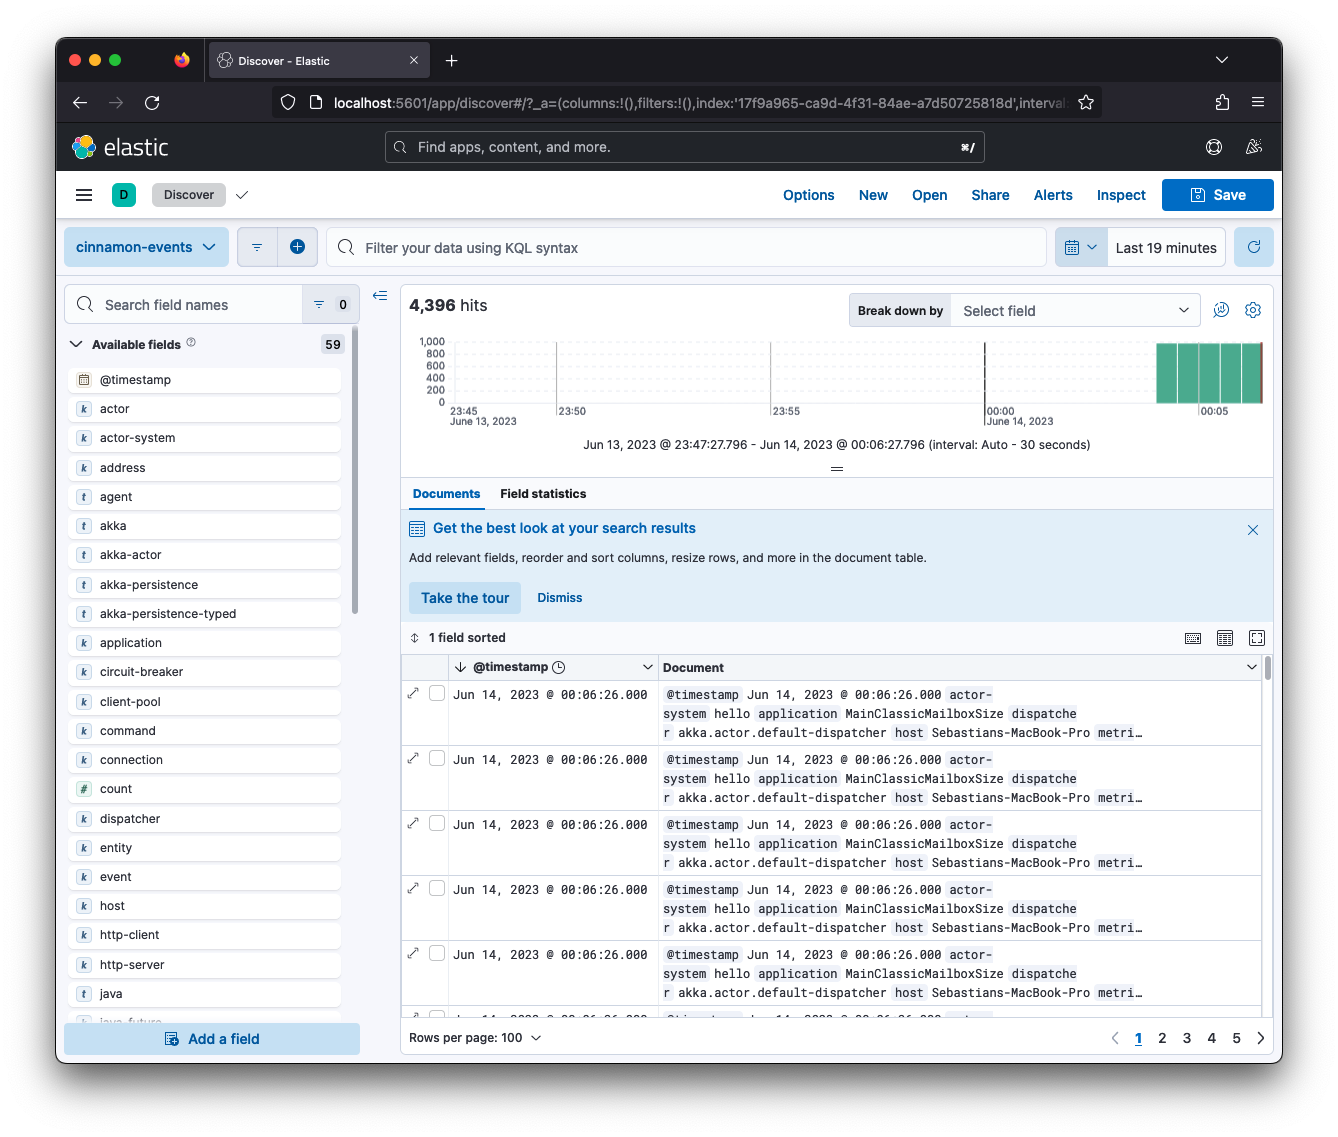
Check the Kibana documentation for more information about how to use the discoverability.
Other indices
Elasticsearch is used as a datasource for all data in the developer sandbox. This means that metric related data is stored there too. Although, Grafana is the primary source for exploring metric data it is also possible to get to individual metric data in Kibana. All metric data is stored in the index cinnamon-metrics-YYYY-MM, where YYYY is the current year and MM is the number of the current month.