Graphite developer sandbox
Developer sandbox components
This developer sandbox uses Graphite with StatsD and Grafana for metric dashboards including example Grafana dashboards for many of the Cinnamon metrics. The following sections contain information about how to configure, run, and explore the sandbox.
Download Graphite developer sandbox
First download Graphite developer sandbox and unzip the developer sandbox scripts. You can do this in a terminal with:
curl -O https://downloads.lightbend.com/cinnamon/sandbox/cinnamon-graphite-docker-sandbox-2.20.3.zip
unzip cinnamon-graphite-docker-sandbox-2.20.3.zip
The unzipped directory contains a Docker Compose file, to download and run the Docker containers for the developer sandbox, and a Grafana plugin with dashboards for Cinnamon metrics.
Run your application with StatsD
Add the Cinnamon dependencies to your application:
- sbt
-
libraryDependencies ++= Seq( Cinnamon.library.cinnamonCHMetrics, Cinnamon.library.cinnamonCHMetricsStatsDReporter ) - Maven
-
<dependency> <groupId>com.lightbend.cinnamon</groupId> <artifactId>cinnamon-chmetrics</artifactId> <version>2.20.3</version> </dependency> <dependency> <groupId>com.lightbend.cinnamon</groupId> <artifactId>cinnamon-chmetrics-statsd-reporter</artifactId> <version>2.20.3</version> </dependency> - Gradle
-
implementation group: 'com.lightbend.cinnamon', name: 'cinnamon-chmetrics', version: '2.20.3' implementation group: 'com.lightbend.cinnamon', name: 'cinnamon-chmetrics-statsd-reporter', version: '2.20.3'
Run your application, configured with a StatsD Reporter.
- application.conf
-
cinnamon.chmetrics { reporters += statsd-reporter }
By default StatsD is configured to use the UDP reporter that may not work correctly with Docker on MacOS. Use the TCP reporter instead as shown in the example below and also uncomment environment: ["STATSD_INTERFACE=tcp"] in the docker-compose.yml file of the Graphite sandbox to switch the StatsD to the TCP protocol.
- Example
-
cinnamon.chmetrics { reporters += "statsd-reporter" statsd-reporter { channel = tcp } }
Start Graphite developer sandbox
To run the Graphite Docker developer sandbox, first change into the unzipped directory at a terminal:
cd cinnamon-graphite-docker-sandbox-2.20.3
Make sure that Docker is running, and then start the developer sandbox using Docker Compose:
docker compose up
This will start Docker containers for Graphite (with StatsD collector) and Grafana.
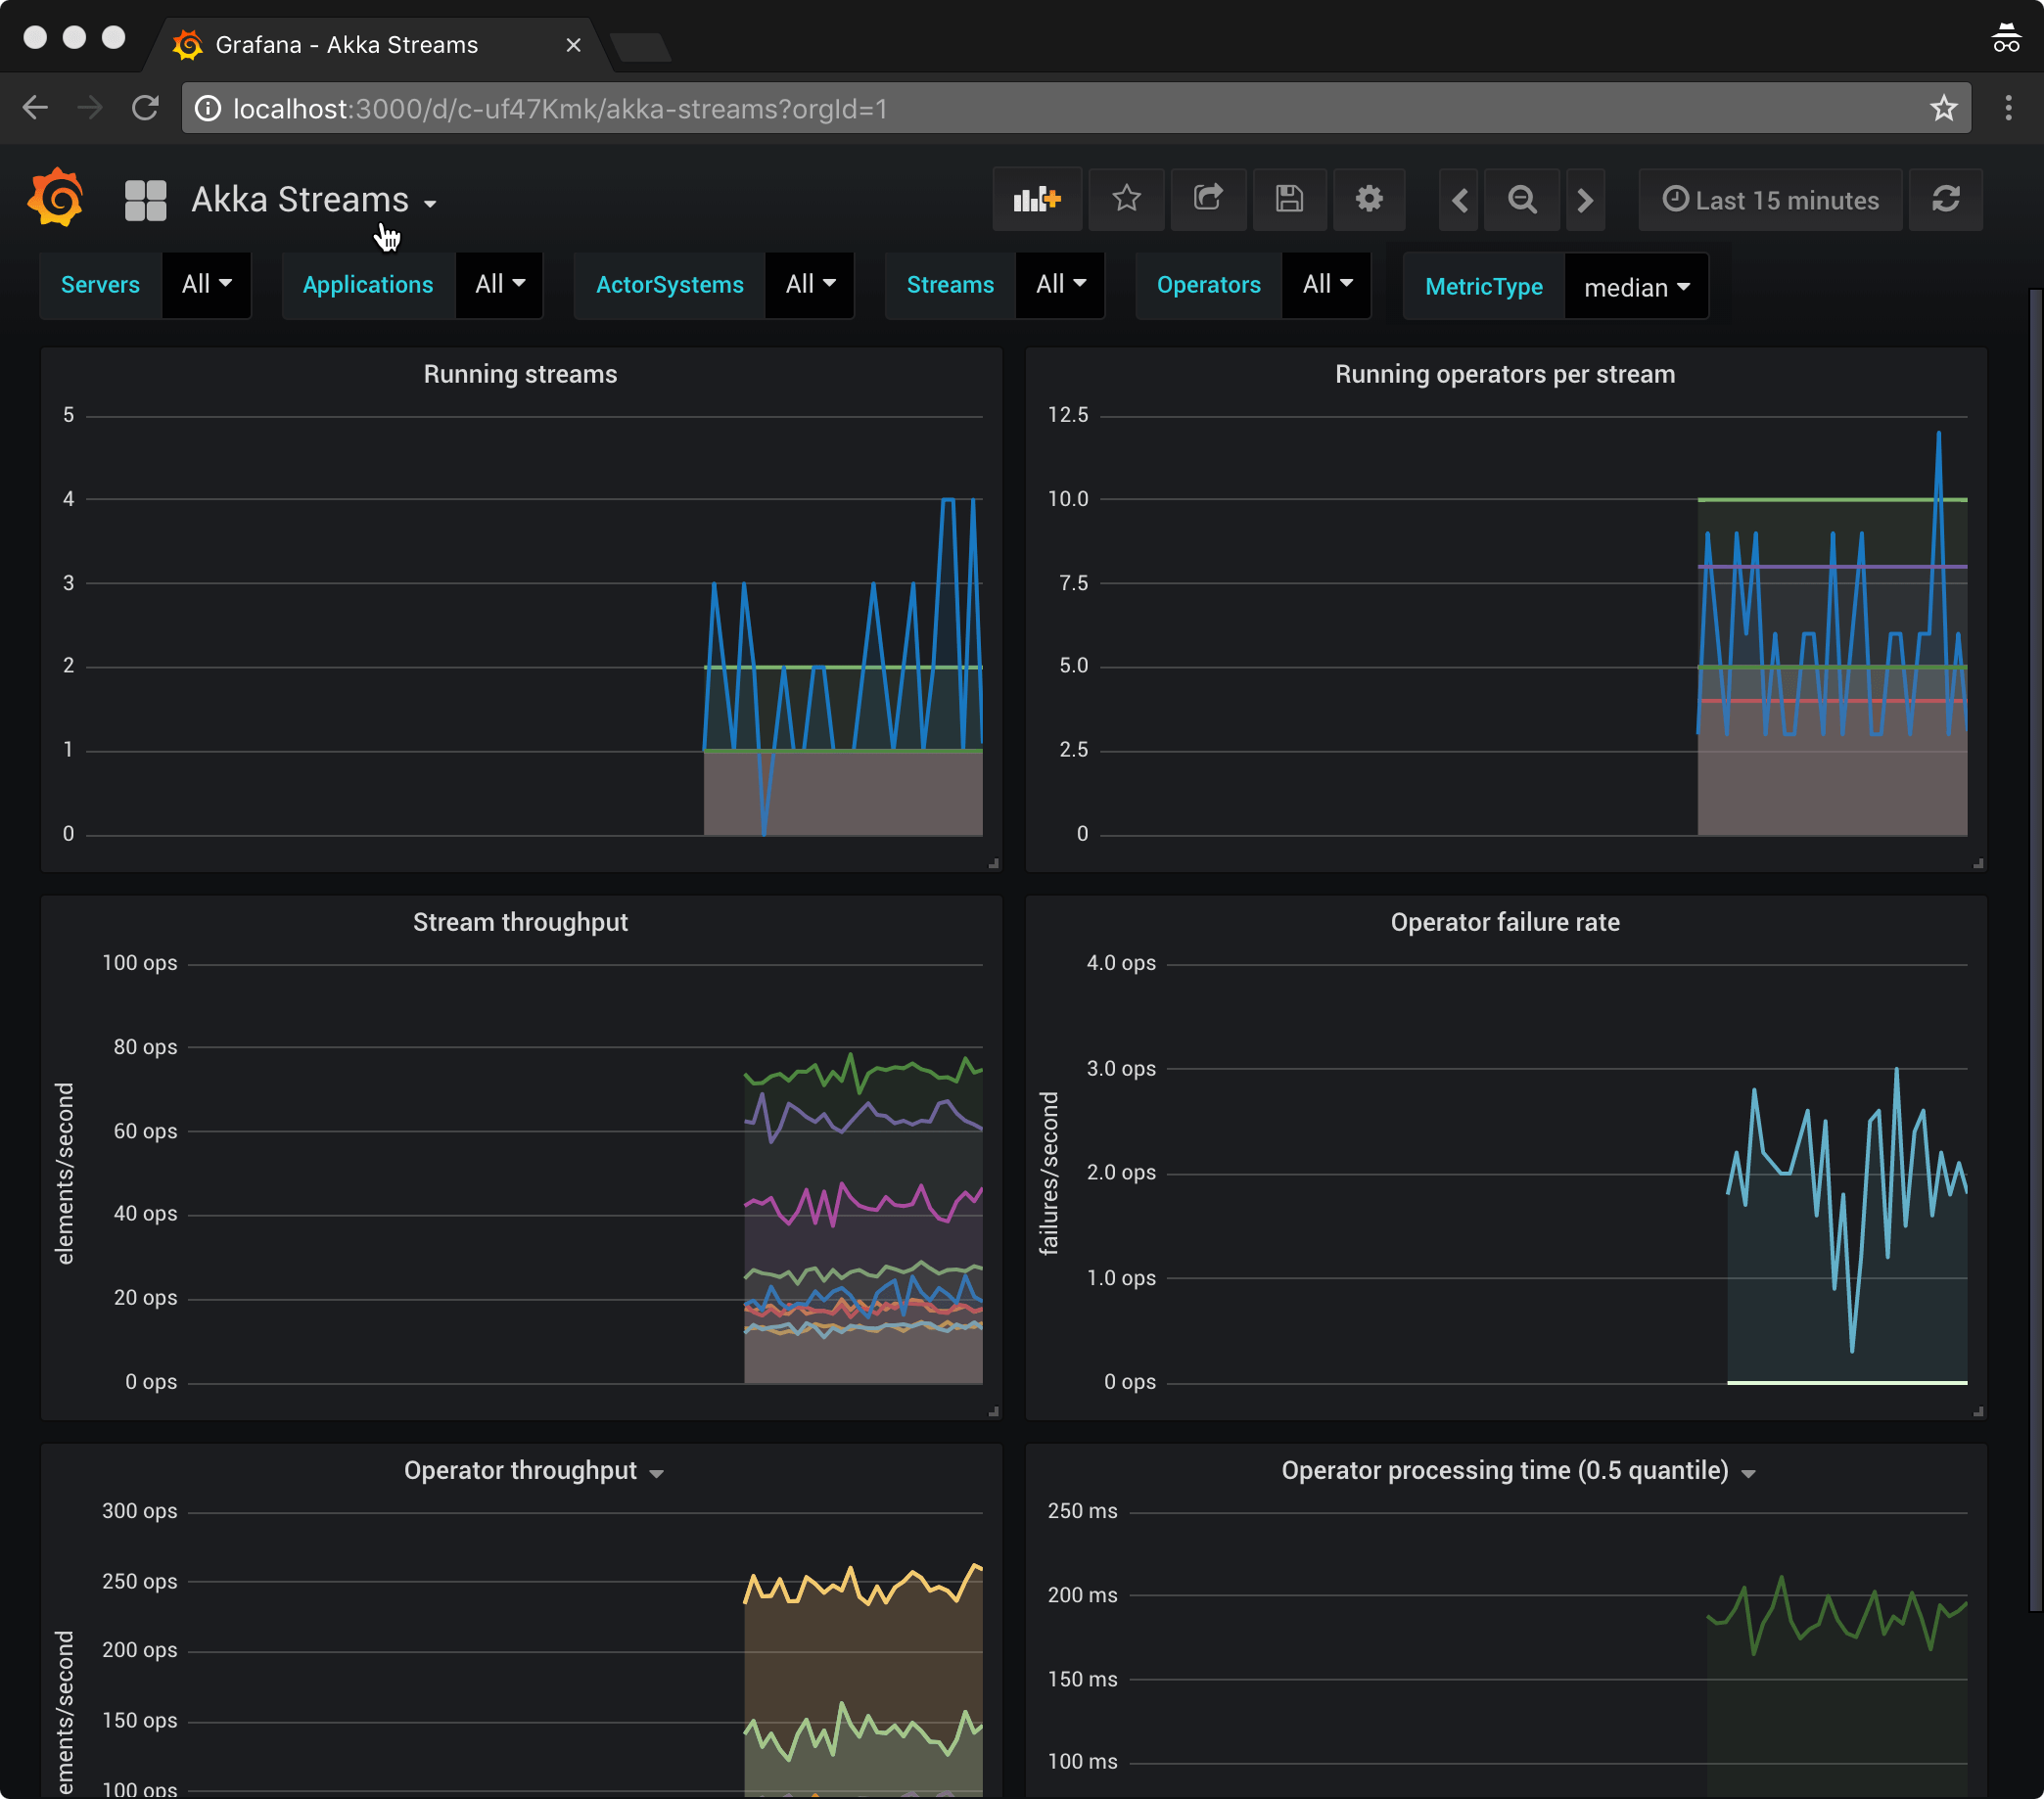
Explore in Grafana
The developer sandbox version of Grafana is available at http://localhost:3000.
You can then view the dashboards, which will begin displaying data from your application:
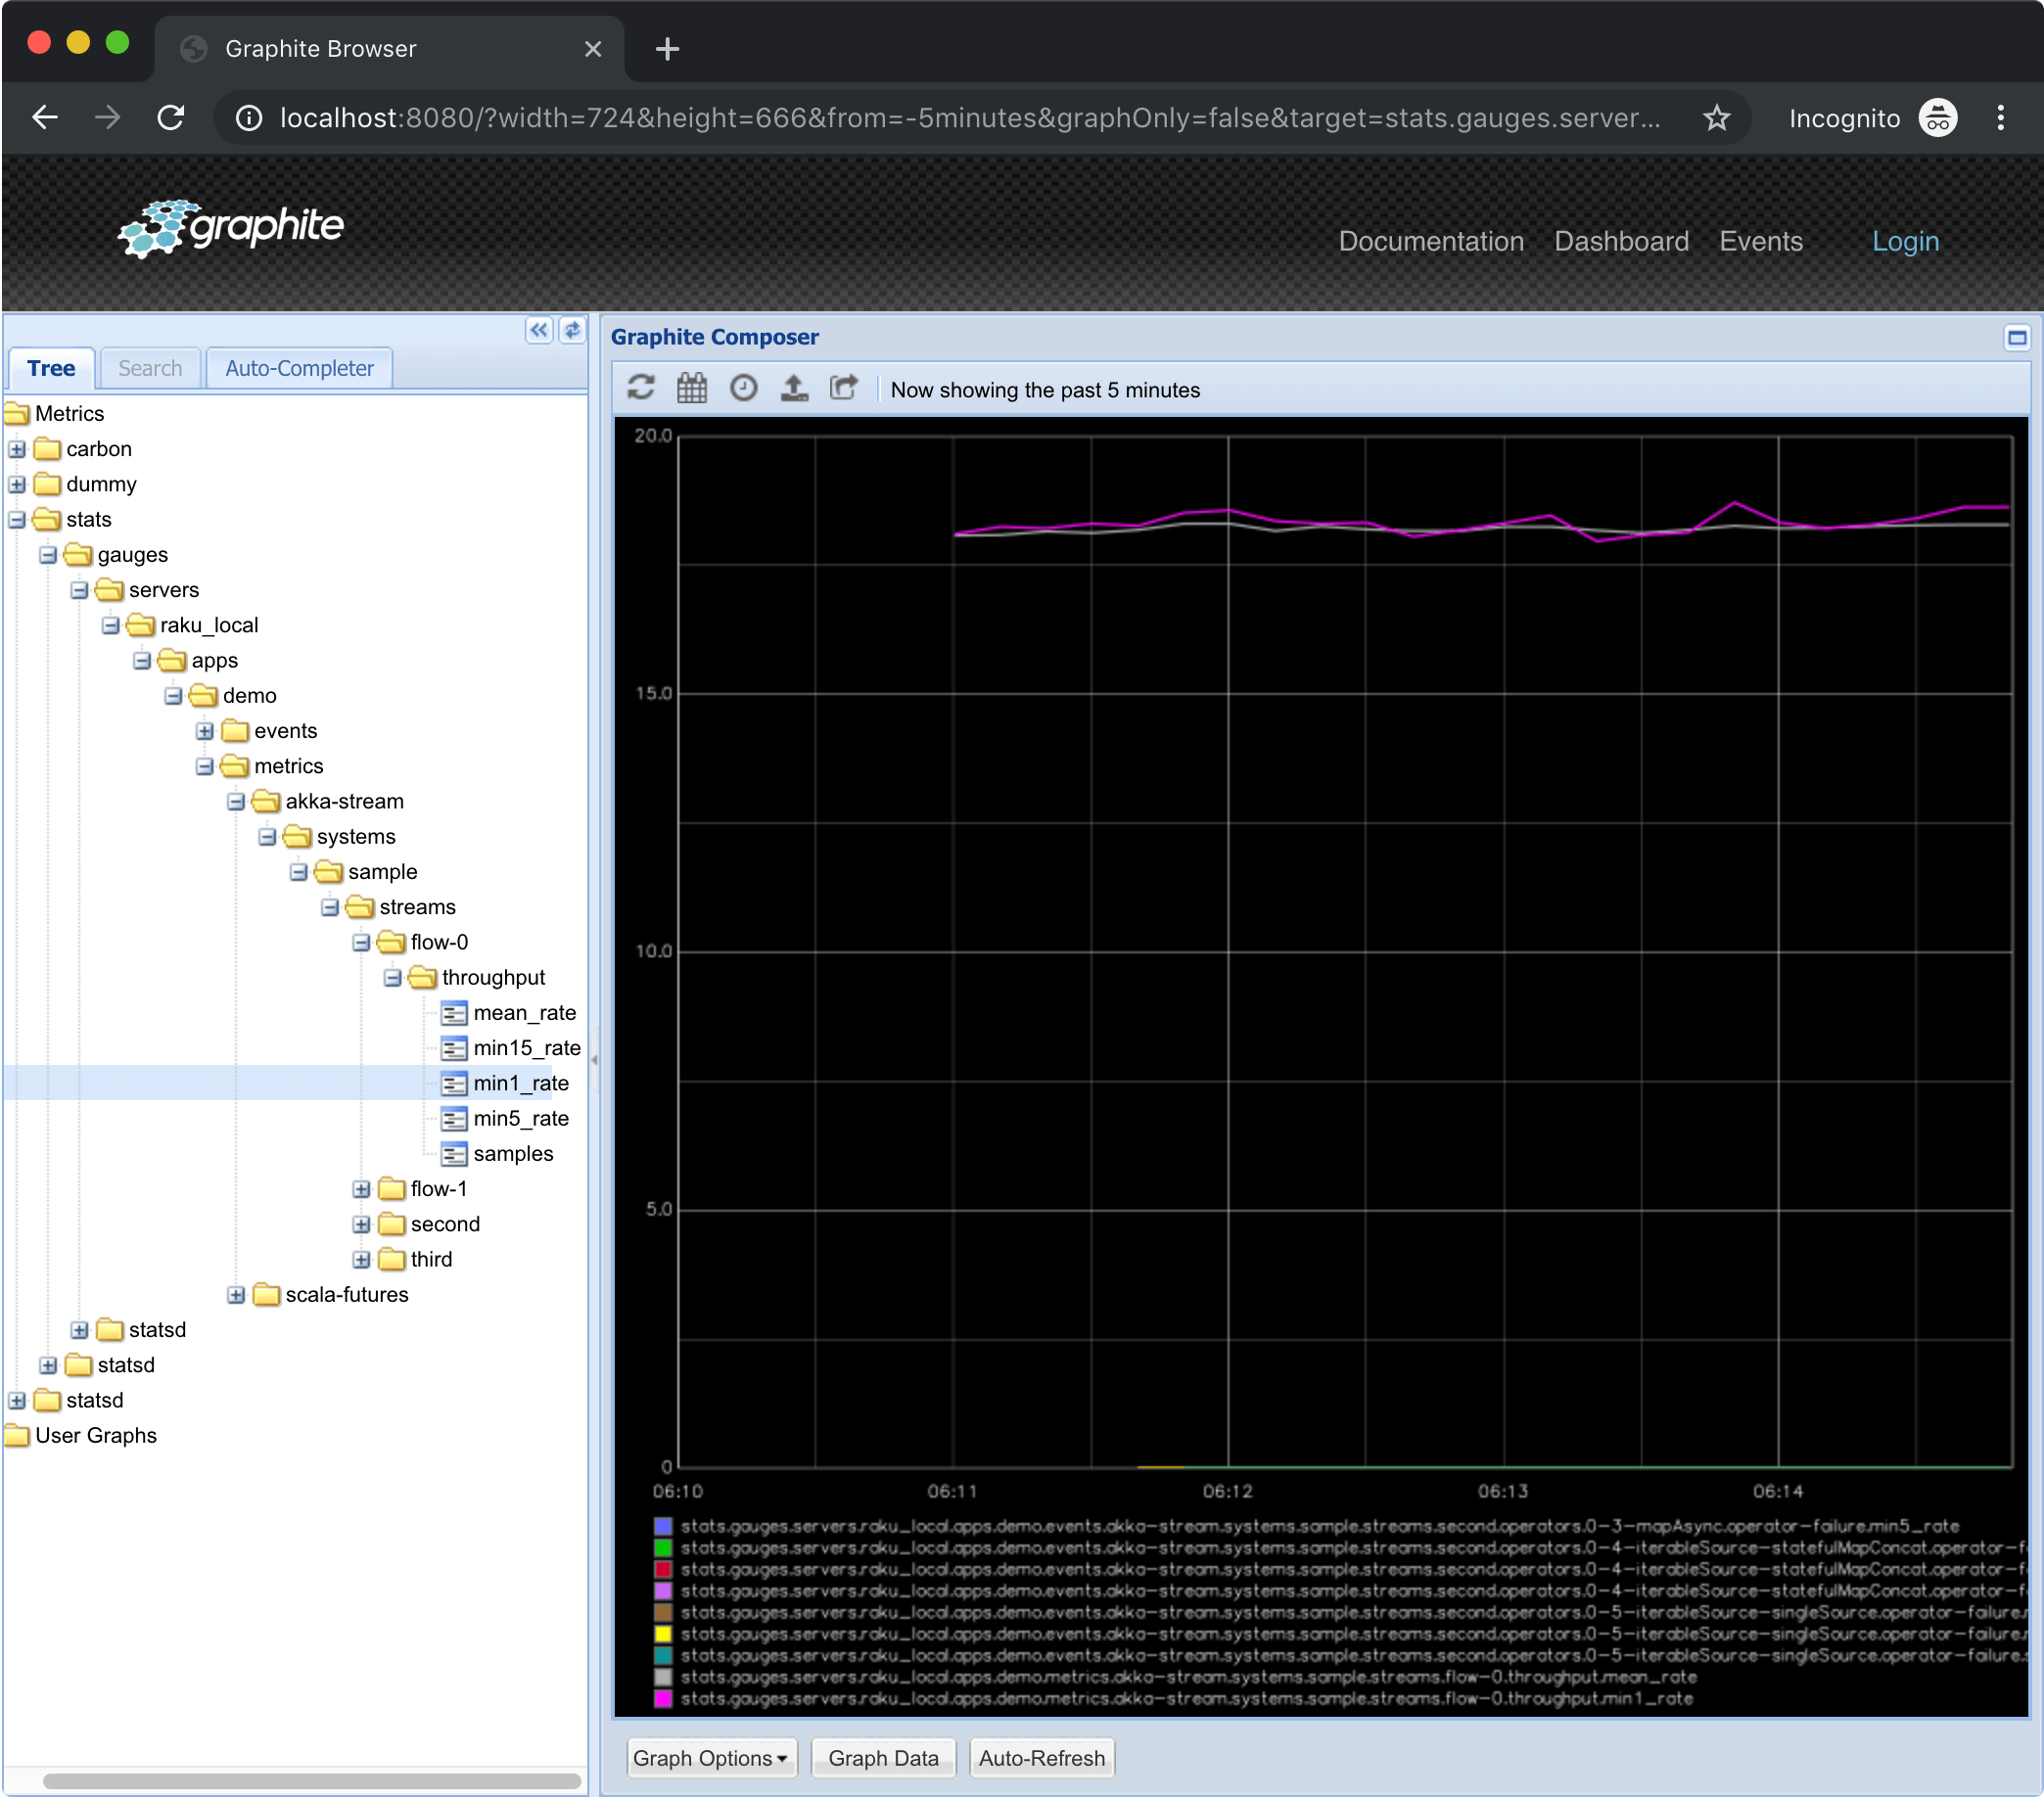
Explore in Graphite
The Graphite Browser is available at http://localhost:8080.