Vizceral
The Vizceral integration is an unsupported and experimental feature that is not fit for production use.
Lightbend Telemetry comes with an experimental Vizceral integration. The Vizceral dashboard, originally used by Netflix to display data traffic, provides an overview of the nodes and actors and their corresponding connections. The Vizceral dashboard can give a better insight into the inner workings of the systems: message flow rates, errors, and warnings.
Prerequisite software
To use the Vizceral dashboard, you must have the following software installed:
Docker Compose
Cinnamon uses Docker Compose to download and run the required Docker images. The Cinnamon Vizceral Docker Compose file can be found here: https://github.com/lightbend/cinnamon-ui/blob/master/cinnamon/vizceral/docker-compose.yml. Download the file to your local machine.
Running
To start up the components required to run Cinnamon Vizceral, go to the location of the downloaded Docker Compose file, and type:
docker-compose up
Allow some time for the Docker images to be downloaded to your local machine the first time you run.
The above command will download and start three Docker images:
- Elasticsearch: Used to store all metrics generated by Cinnamon.
- Cinnamon Vizceral: A Vizceral backend service that retrieves data from Elasticsearch, converts it to JSON, and pushes it to the frontend.
- Cinnamon Vizceral Frontend: The Vizceral visualization.
The Cinnamon Vizceral Frontend is running on localhost:8080.
The Elasticsearch Docker image requires quite a lot of memory for the best experience. Make sure to configure Docker more than 4GB of memory if possible.
Configuring Cinnamon
To be able to visualize anything we must ensure that data is being published into Elasticsearch. Add the Cinnamon Elasticsearch reporter, make sure to enable experimental.connections=true for the actors that are being monitored and that cinnamon.akka.dimensions += address is added to the configuration:
cinnamon {
akka.actors {
"/user/*" {
report-by = class
experimental.connections = true
}
}
akka.dimensions += address
chmetrics {
reporters += "elasticsearch-reporter"
elasticsearch-reporter {
basic-auth {
username = "elastic"
password = "changeme"
}
}
}
}The UI
The Cinnamon Vizceral UI consists of two communication layers: nodes and actors.
Communication is visualized by a thin connection between two entities. The animation shows the direction that messages are flowing in. This can be bi-directional. Vizceral uses color coding to indicate a different type of messages:
- White: A regular message.
- Orange: A message causing a warning which corresponds to DeadLetter, UnhandledException, or log warning.
- Red: A message causing an error/danger which corresponds to an exception or log error.
The Vizceral visualization is not showing the order of messages correctly. Looking at the UI visualization, one can get the impression that some messages overtake others. This is only a UI feature and not a real representation of how ordering of Akka messages work.
Use the breadcrumbs in the upper left corner to navigate layers, and the menu on the right side to filter, enable dragging of nodes, physics for more animations, etc.
Interpretation of the visualization
Messages flowing between entities indicate direction. If ActorA sends messages to ActorB, then there will be a connection between the two and the messages will flow from ActorA to ActorB. If messages are sent in both directions, there will be animations showing messages flowing bidirectionally.
It is important to understand that all animations are approximations of the messages sent in the monitored system. The metrics used by the animations are message rates: in Cinnamon, we use the one minute moving average of messages/second.
Errors and warnings, although happening on the receiving end, are being visualized as being sent from an actor/node to another. This means that if ActorA sends a message to ActorB that causes an exception, there will be red dots indicating this relation.
Messages sent to non-existing actors, i.e., ones that end up in dead letter, are being explicitly visualized by adding a dead letter actor to the visualization (see below.)
Node communication layer
The node layer shows nodes that are communicating. In the example below, we can see three nodes, all running on the same machine: 127.0.0.1_2552, 127.0.0.1_51932, and 127.0.0.1_51942.
Clicking on an entity at the node level will enable a layered table with the underlying actors and some information thereof. Double-clicking will take you to the underlying layer.
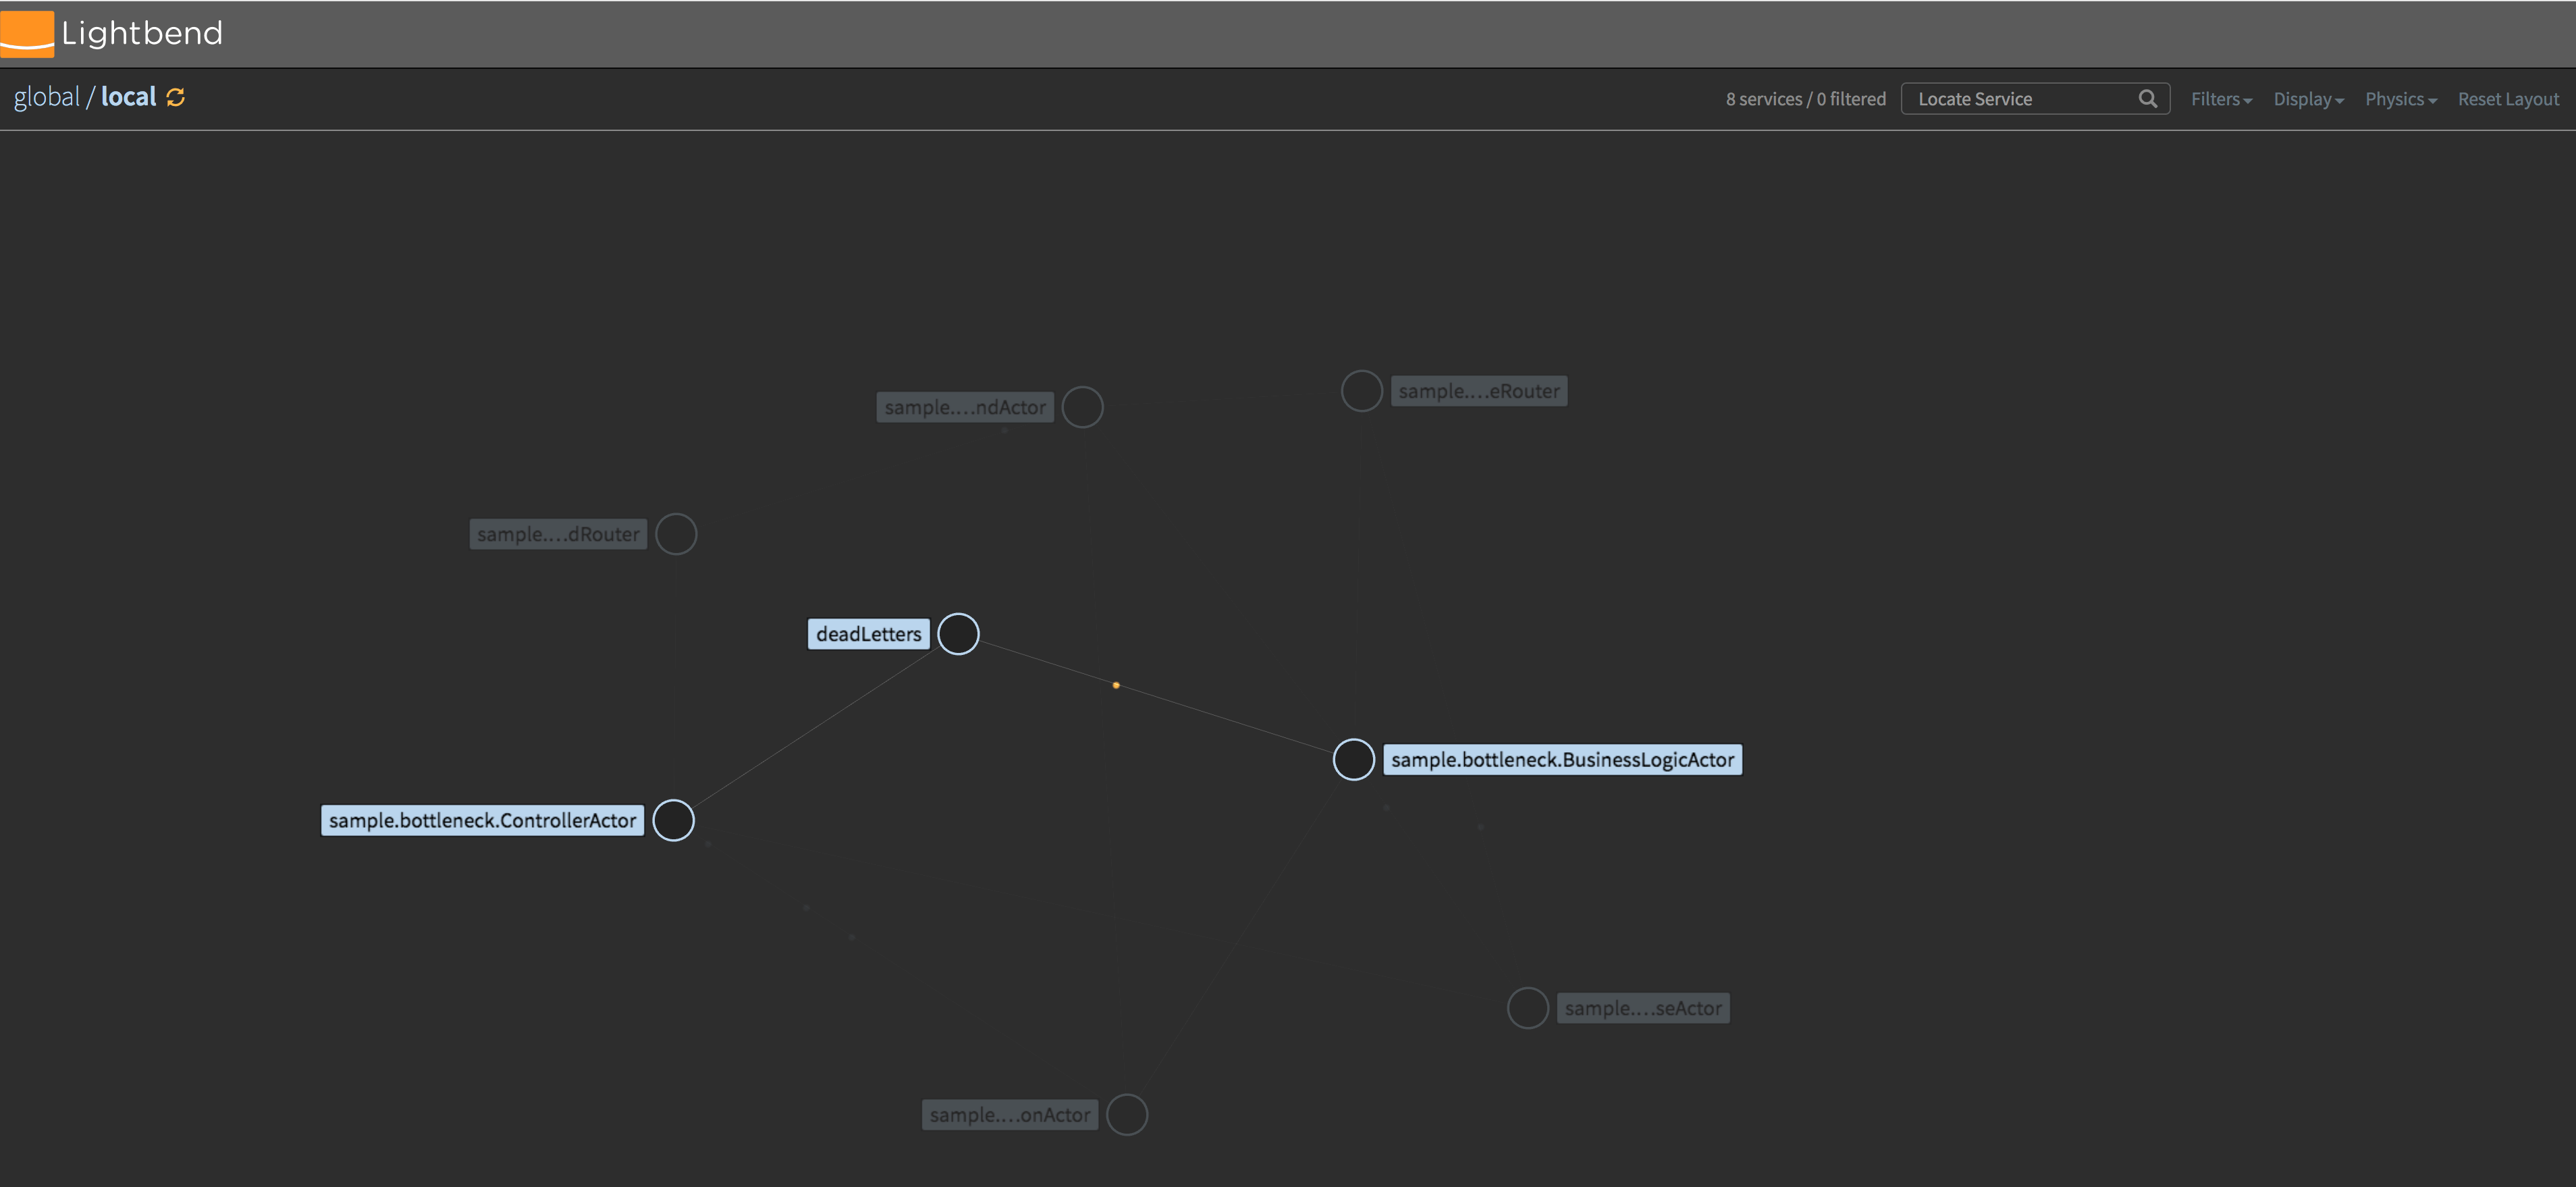
Actor communication layer
The images below show what the actor communication can look like. All actors that communicate are visualized with their corresponding connections.
Hovering the mouse over a specific actor highlights actors that it communicates with by either sending or receiving messages. In the case below we highlight the dead letter actor to get an understanding of what actors that are sending messages to dead letter:
The actor layer will also show any remote nodes that are communicating, i.e., sending or receiving messages to/from any actor in the viewed actor system. These nodes, if any, will be shown with IP address and port and there will be lines connected between the nodes and the actors that have connections.
Troubleshooting
If you get stuck at the loading screen, there are a couple of things to check.
Check containers
First, are all the right containers running?
$ docker ps -a --format "{{.Names}}" | grep cinnamonsamplevzc
cinnamonsamplevzc_web_1
cinnamonsamplevzc_backend_1
cinnamonsamplevzc_kibana_1
cinnamonsamplevzc_elasticsearch_1
If any of the containers are not running, then CTRL-C the docker-compose command and make sure that all containers are stopped and removed.
$ docker ps -a --format "{{.Names}}" | grep cinnamonsamplevzc | xargs docker stop
$ docker ps -a --format "{{.Names}}" | grep cinnamonsamplevzc | xargs docker rm -f
Then restart docker-compose up and check again.
If all containers are running, then you should run your application so it produces some metrics, and try to load the vizceral page at http://localhost:8080/ again. If you still get stuck at the loading screen, then you need to go to kibana to check if your data go into elastic search.
Check metrics in Kibana
Open the Kibana page at http://localhost:5601.
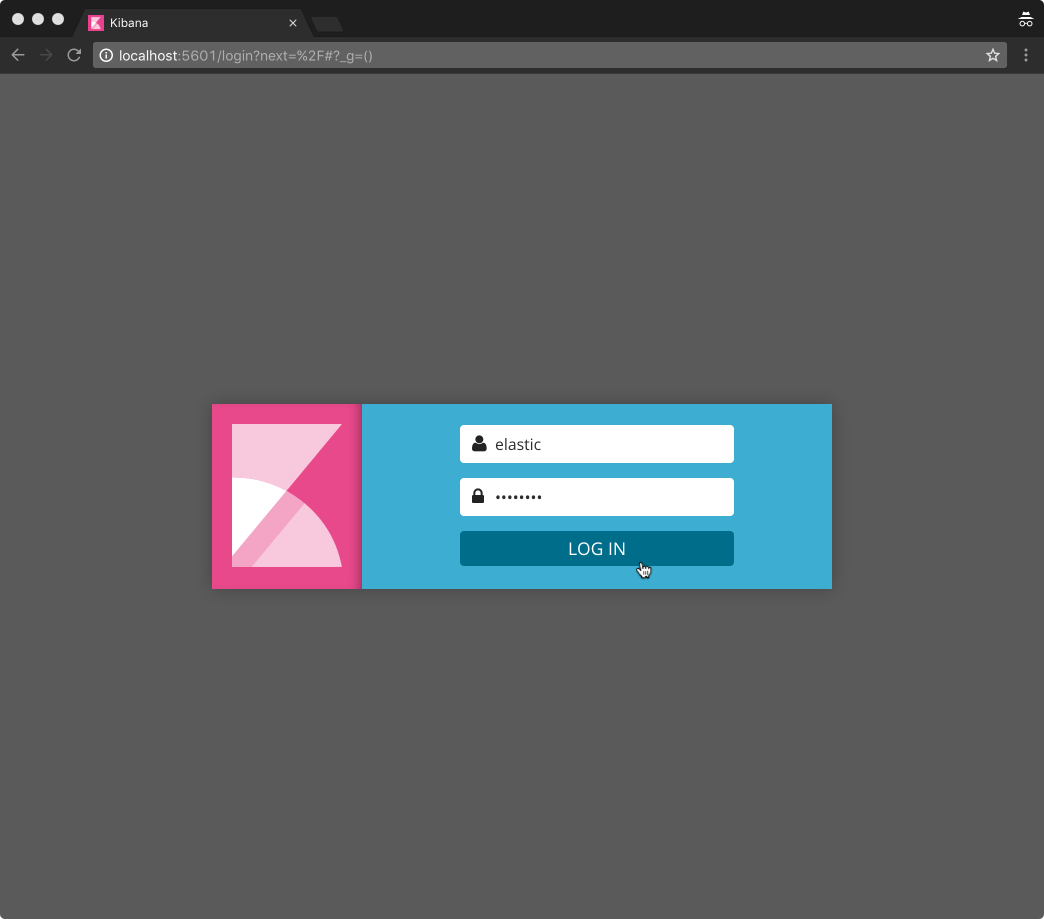
Kibana log in
First log in to Kibana. The default user/password is elastic/changeme:
Create index
Before you can start exploring data in Kibana, you must set up an index. The Index Patterns page should be the default page after logging in, when there are no indices already defined. You can navigate to this page by selecting Management then Kibana > Index Patterns.
Enter cinnamon-metrics-YYYY-MM for the Index pattern, where YYYY is the current year and MM is the current month.
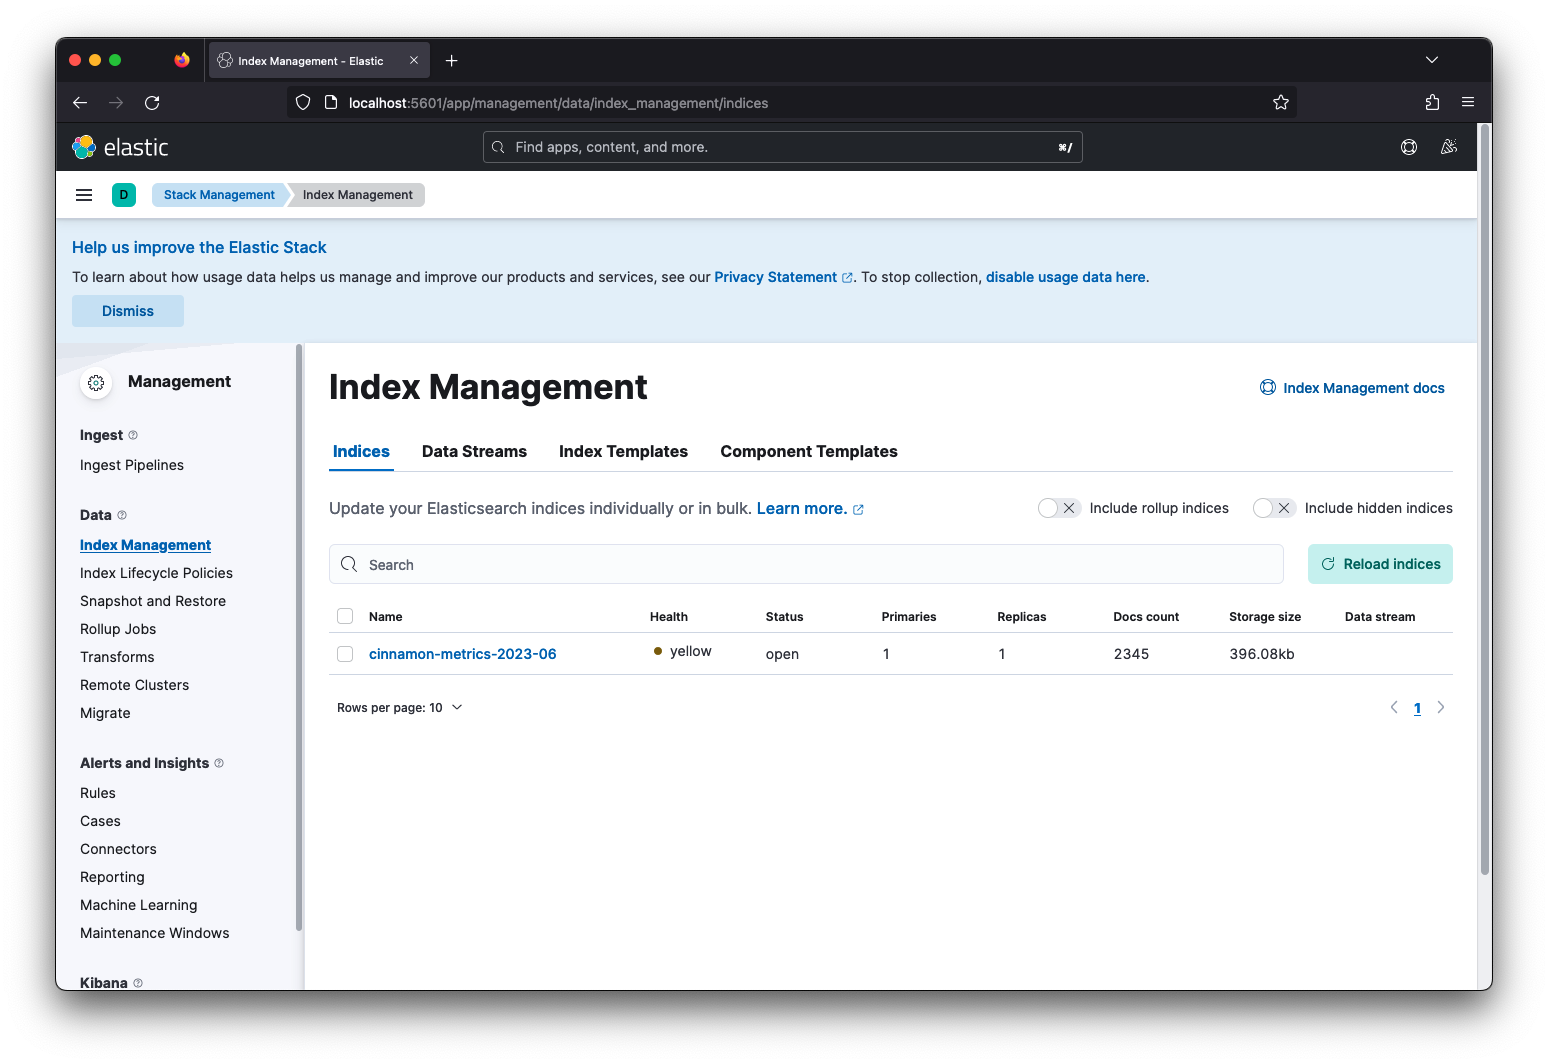
If metrics have been reported into elastic search, you should be able to use the Discover tab to view the metrics. Otherwise you will be stuck at welcome screen with the error message “Unable to fetch mapping. Do you have indices matching the pattern?”.
Explore data
To explore the data in Kibana you click on the Discover tab and select a specific index, e.g. cinnamon-metrics-2019-01:
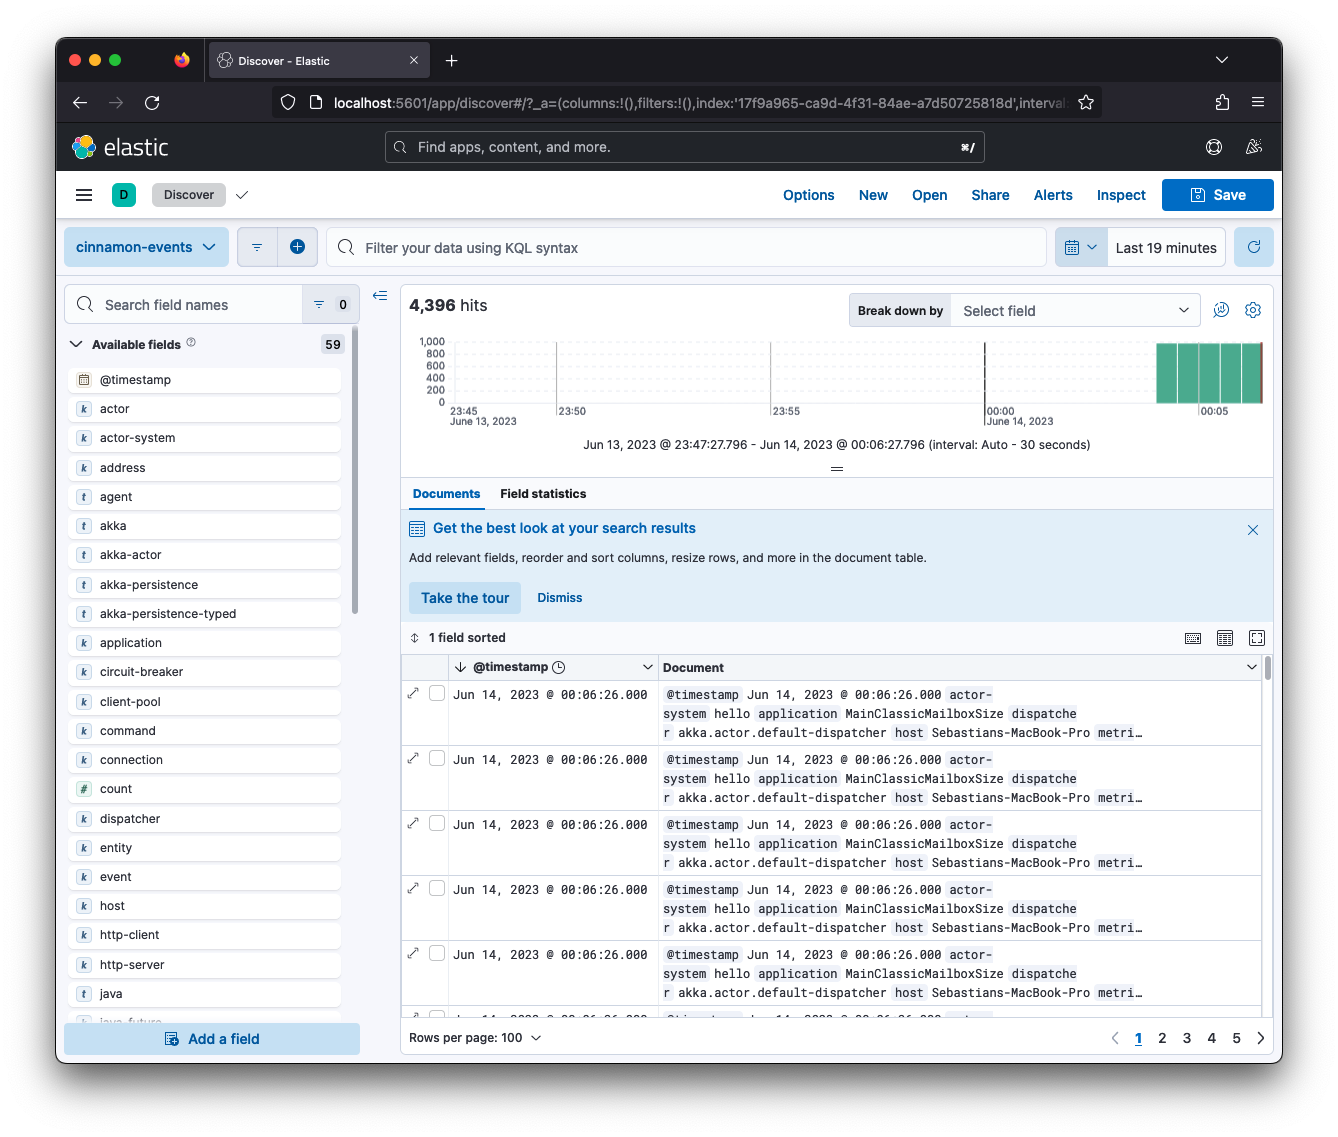
Check the Kibana documentation for more information about how to use the discoverability.