Introduction
Distributed systems are complex and have many moving parts, much of which are asynchronous and run in parallel. When building complex systems, it is best to consider design in small chunks that are composable. Instrumenting complex systems is no different. Lightbend Telemetry breaks capture down into composable parts that will provide better insight into your system.
Overview
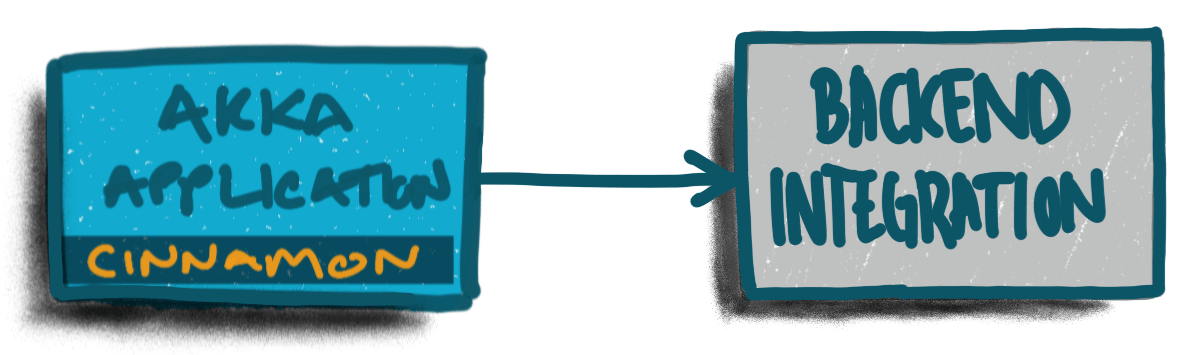
Lightbend Telemetry provides insight into applications built with Lightbend technologies. It does so by instrumenting frameworks and toolkits such as Akka. The instrumentation is done by a Java agent that runs when your application is starting up. Lightbend Telemetry (a.k.a. Cinnamon) collects information, in runtime, about your application based on a configuration that you must provide. As you can see below, Cinnamon is running in the same JVM as your application.

Based on configuration, Telemetry will send data to a backend of your choice, providing integrations with Elasticsearch, StatsD, Datadog, JMX, etc. It is also possible to provide a custom integration should the backend of your choice not be available.
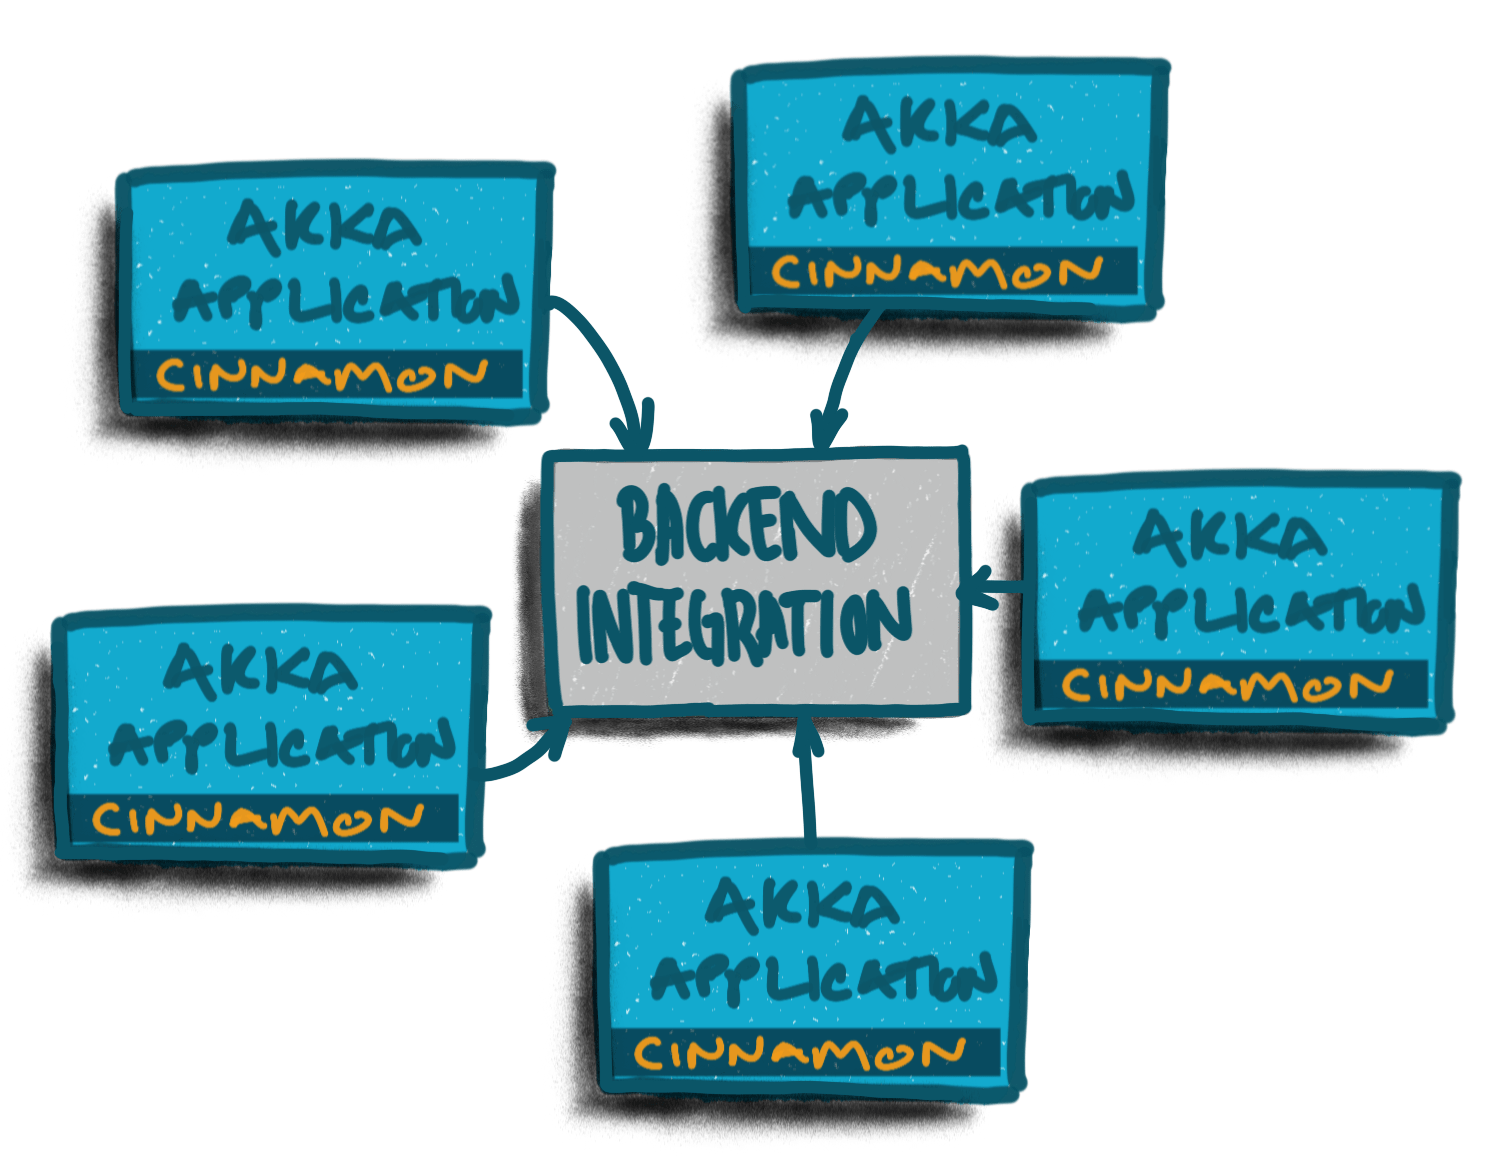
Cinnamon running in a cluster
If you run a cluster or multiple nodes in general, Cinnamon will run on each node. Each individual node will report to the backend you have configured:
Cinnamon integration
By using configuration, you can instruct how Cinnamon should report the information it is collecting. Out of the box, Cinnamon provides several plugins.
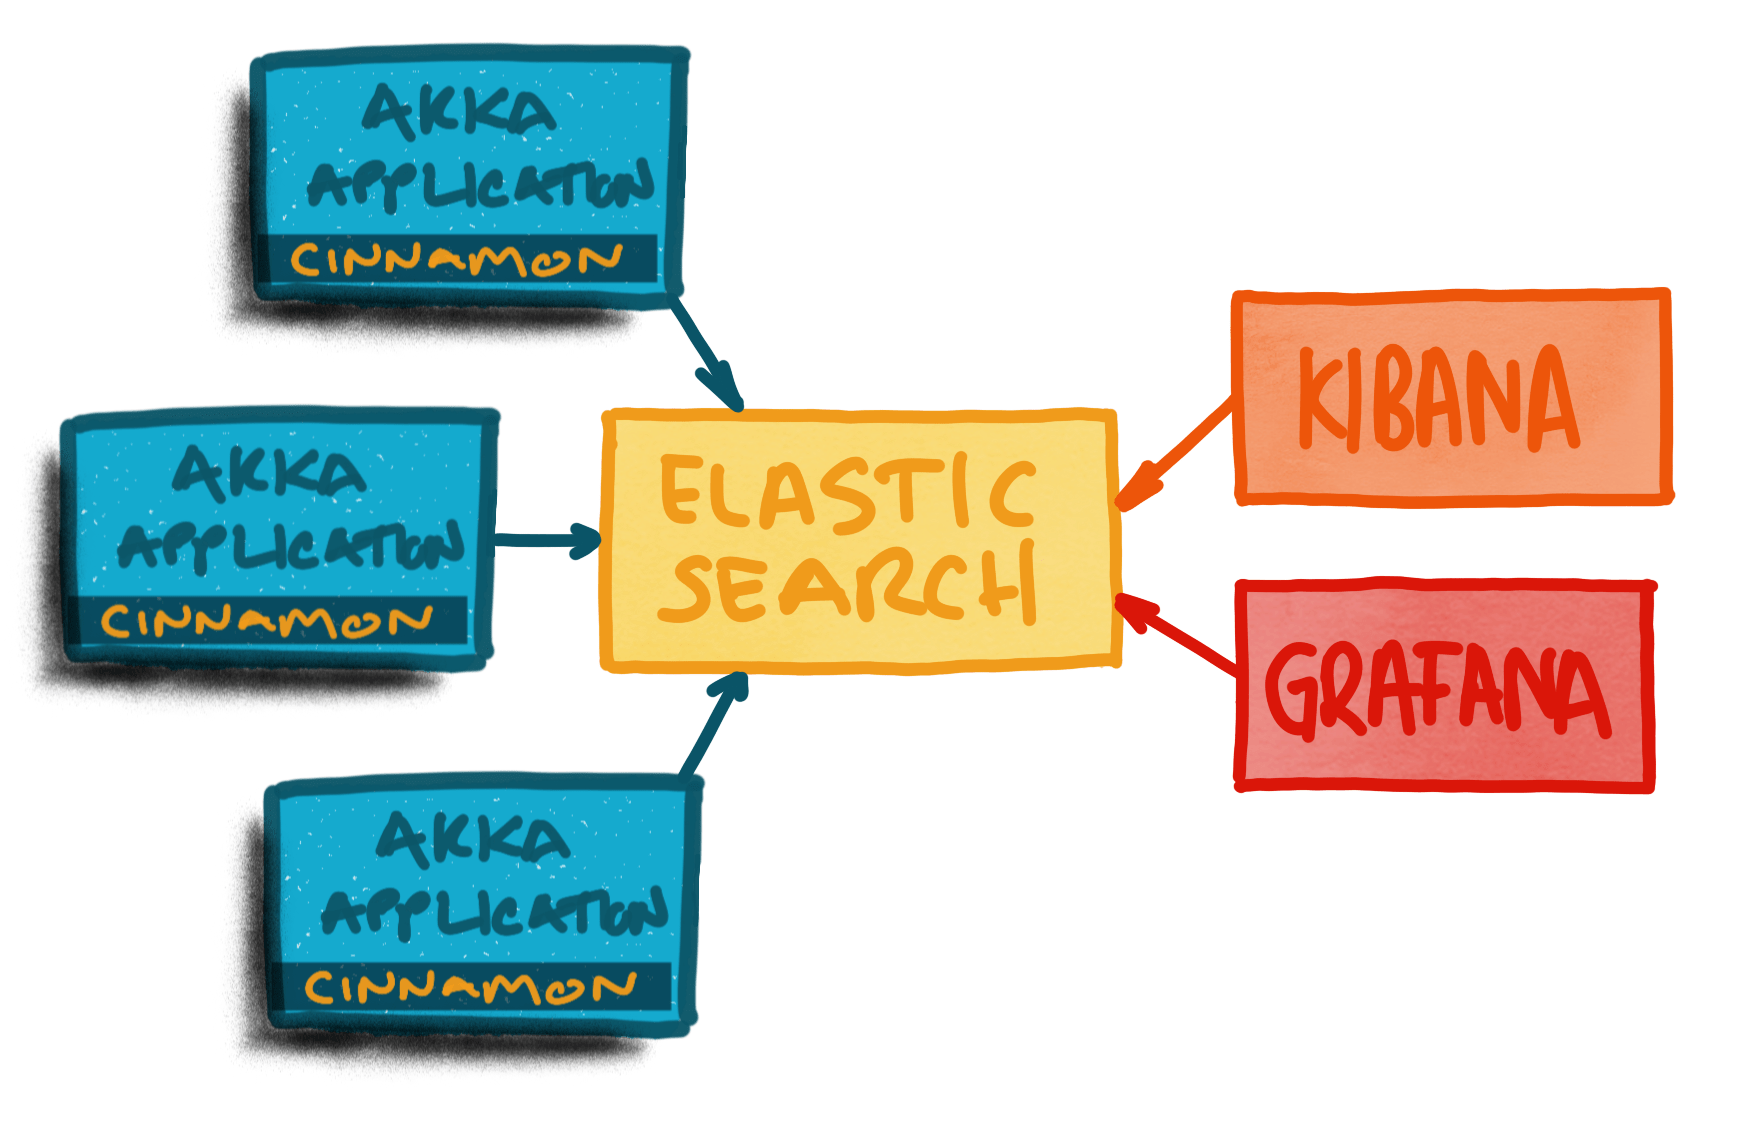
Below is an example of what this may look like for integration with Elasticsearch. In this example, we also use Kibana and Grafana to retrieve and display the information that gets published into Elasticsearch. This also happens to be the setup of the Cinnamon developer sandbox environment: an easy way to bootstrap and try Cinnamon out.
Lightbend Telemetry architecture
Lightbend Telemetry is built up from multiple parts, described here below. Lightbend Telemetry requires a subscription. You can contact Lightbend to request an evaluation.
Instrumentations
Instrumentations are the enablers of our stack that hook into the underlying toolkit or framework for our telemetry solution. Currently, we support Akka, Scala Futures, and Java Futures with the following feature sets:
- Akka: captures telemetry (metrics, events, or traces) for Akka Actors, Akka Remoting, Akka Cluster, and Akka Persistence.
- Akka Streams: captures telemetry (metrics, events, or traces) for Akka Streams.
- Akka HTTP: captures server, endpoint, and client telemetry (metrics or traces) for Akka HTTP applications.
- Scala Futures: captures telemetry (metrics or traces) for explicitly named Futures.
- Java Futures: captures telemetry (metrics or traces) for explicitly named CompletableFutures.
Instruments
Instruments are the nitty gritty of our stack. Keeping composable design in mind, we classify our instruments into one of three categories: metrics, events, or traces. Our metrics represent a unit of measure within a time constraint, whereas our events embody historical behavior.
- Metrics include counters, gauges, and rates.
- Events include errors, unhandled messages, and dead letters.
- Traces follow asynchronous or distributed message flows.
Extensions
Asynchronous boundaries are one of the primary challenges behind instrumenting distributed systems. It is difficult to reason about behavior when stuff does not happen in the order we think it should. To manage this, Lightbend Telemetry provides context propagation in the form of OpenTracing integration, Mapped Diagnostic Context (MDC), and the Stopwatch extension. You can think of them as buckets designed to capture data of a particular type or path regardless of when or where it occurs.
- OpenTracing
- SLF4J MDC
- Stopwatch
- Custom Events
- Custom Metrics
- JMX Importer
- JVM Metrics producer
- Producers
Backend Plugins
Our telemetry solution is designed to support pluggable backends for metric, event, and trace data. Lightbend Telemetry provides the following backend plugins:
- OpenTelemetry (metrics and event rates)
- Prometheus (metrics and event rates)
- Datadog (metrics and event rates)
- Coda Hale Metrics (metrics and event rates)
- StatsD (metrics and event rates)
- Elasticsearch (metrics and events)
- SLF4J events (events)
- Jaeger (traces)
- Zipkin (traces)
- Datadog (traces)
It is possible to use multiple backends simultaneously.
Visualizations
At the end of the day, we have to reason about the data we capture, and as they say, a picture is worth a thousand words. In this vein, we provide plugins for the following visualization suites:
Developer sandbox
Lightbend Telemetry provides a developer sandbox environment that you can use to quickly get started. Unless you already have your monitoring infrastructure set up, using the developer sandbox is the fastest way to test your application with Lightbend Telemetry. The developer sandbox comes prepackaged with Elasticsearch, Kibana and Grafana all configured to be used in together. The developer sandbox is only for testing purposes and is not intended for production.