Datadog reporter
Datadog supports distributed tracing compatible OpenTracing via their APM service.
Cinnamon Datadog dependency
First make sure that your build is configured to use the Cinnamon Agent.
To enable the Datadog reporter, add the following dependencies to your build:
- sbt
-
libraryDependencies += Cinnamon.library.cinnamonOpenTracing libraryDependencies += Cinnamon.library.cinnamonOpenTracingDatadog - Maven
-
<dependency> <groupId>com.lightbend.cinnamon</groupId> <artifactId>cinnamon-opentracing_2.13</artifactId> <version>2.20.3</version> </dependency> <dependency> <groupId>com.lightbend.cinnamon</groupId> <artifactId>cinnamon-opentracing-datadog</artifactId> <version>2.20.3</version> </dependency> - Gradle
-
dependencies { implementation group: 'com.lightbend.cinnamon', name: 'cinnamon-opentracing_2.13', version: '2.20.3' implementation group: 'com.lightbend.cinnamon', name: 'cinnamon-opentracing-datadog', version: '2.20.3' }
Datadog reporter configuration
You must have an accessible Datadog agent running with APM enabled (it is turned on by default in version 6.x+ of the Datadog agent). An example of manually enabling this can be found in the Datadog docker agent documentation.
Datadog reporting can be configured. On the Example tab, there is a configuration that sets a different endpoint for the Datadog agent by configuring the agent.host and trace.agent.port settings:
- Required
-
There is nothing to configure if you want to use the default Datadog settings that will communicate with the agent at
localhoston port8126. - Example
-
cinnamon.opentracing { datadog { trace.agent.url = "http://remote-dd-agent.my.org:8443" } } - Reference
-
cinnamon.opentracing { # Whether to allow null spans to be activated. # Disabled because null spans are not compatible with Datadog tracer. activate-null-spans = off # Whether to activate dummy spans for context-only trace propagation. # Disabled because context-only spans are not compatible with Datadog tracer. activate-context-only-spans = off datadog { # Any key found at https://docs.datadoghq.com/tracing/setup/java/#configuration may be specified here, minus the 'dd.' prefix # See dd.service.name service.name = null # See dd.service.mapping (e.g., "mysql:my-service-name-db") service.mapping = null # See dd.writer.type (e.g., "DDAgentWriter" or "LoggingWriter") writer.type = "DDAgentWriter" # See https://docs.datadoghq.com/tracing/setup/java/#b3-headers-extraction-and-injection (e.g., "Datadog,B3") propagation.style.inject = "Datadog" # See https://docs.datadoghq.com/tracing/setup/java/#b3-headers-extraction-and-injection (e.g., "Datadog,B3") propagation.style.extract = "Datadog" # See dd.agent.host agent.host = "localhost" # See dd.trace.agent.port trace.agent.port = 8126 # See dd.trace.agent.unix.domain.socket trace.agent.unix.domain.socket = null # See dd.trace.enabled trace.enabled = true # See dd.trace.global.tags (e.g., "key1:value1,key2:value2") trace.global.tags = null # See dd.trace.span.tags (e.g., "key1:value1,key2:value2") trace.span.tags = null # See dd.trace.jmx.tags (e.g., "key1:value1,key2:value2") trace.jmx.tags = null # See dd.trace.header.tags (e.g., "CASE-insensitive-Header:my-tag-name,User-ID:userId") trace.header.tags = null # See dd.trace.annotations trace.annotations = "com.newrelic.api.agent.Trace;kamon.annotation.Trace;com.tracelytics.api.ext.LogMethod;io.opentracing.contrib.dropwizard.Trace;org.springframework.cloud.sleuth.annotation.NewSpan" # See dd.trace.methods (e.g., "package.ClassName[method1,method2,...];AnonymousClass$1[call]") trace.methods = null # See dd.trace.partial.flush.min.spans trace.partial.flush.min.spans = 1000 # See dd.trace.report-hostname trace.report-hostname = false # See dd.trace.health.metrics.enabled trace.health.metrics.enabled = false # See dd.trace.split-by-tag trace.split-by-tags = null # See dd.trace.db.client.split-by-instance trace.db.client.split-by-instance = false # Enable MDC injection? See dd.logs.injection logs.injection = false # See dd.http.client.tag.query-string http.client.tag.query-string = false # See dd.http.server.tag.query-string http.server.tag.query-string = false # See dd.http.client.error.statuses http.client.error.statuses = null # See dd.jmxfetch.enabled jmxfetch.enabled = true # See dd.jmxfetch.config.dir jmxfetch.config.dir = null # See dd.jmxfetch.config jmxfetch.config = null # See dd.jmxfetch.check-period jmxfetch.check-period = 1500 # See dd.jmxfetch.refresh-beans-period jmxfetch.refresh-beans-period = 600 # See dd.jmxfetch.statsd.host jmxfetch.statsd.host = ${cinnamon.opentracing.datadog.agent.host} # See dd.trace.health.metrics.statsd.host trace.health.metrics.statsd.host = ${cinnamon.opentracing.datadog.jmxfetch.statsd.host} # See dd.jmxfetch.statsd.port jmxfetch.statsd.port = 8125 # See dd.trace.health.metrics.statsd.port trace.health.metrics.statsd.port = ${cinnamon.opentracing.datadog.jmxfetch.statsd.port} } }NoteThese settings are defined in the
reference.conf. You only need to specify any of these settings when you want to override the defaults.
Getting started with Datadog
See the getting started guide for an introduction to Datadog, and how to get up and running with APM and tracing.
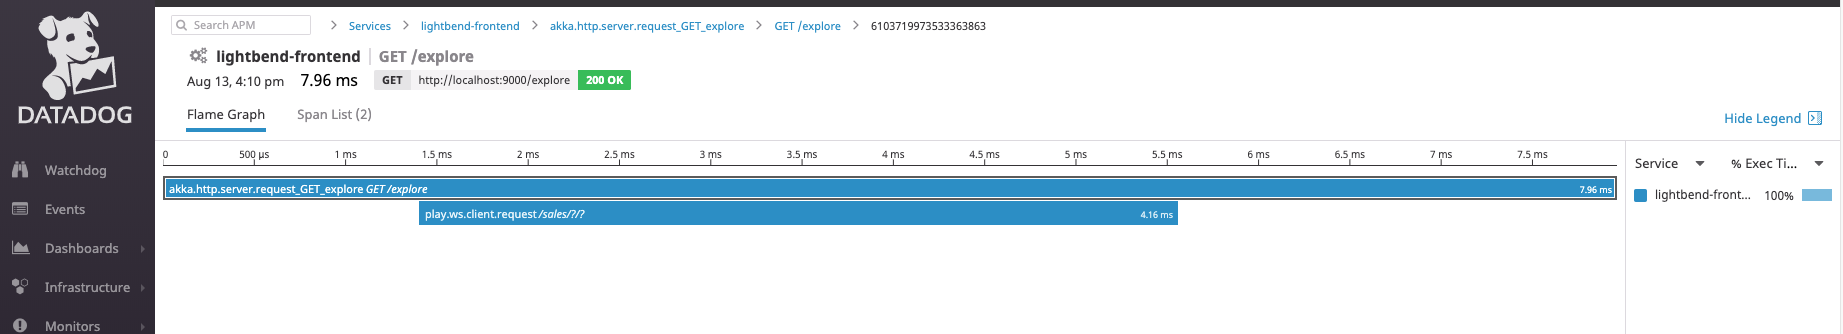
Here’s what an example trace in Datadog looks like:
Further tracer configuration
The OpenTracing integration for Datadog supports the following configuration:
Setting a service name for each node is useful. The service name can be configured specifically for tracing using the service.name setting (example below) or otherwise this will be based on the application name from the shared Cinnamon metadata. You can use the cinnamon.application setting to configure the same name for both metrics and tracing.
Global tags can be added to the tracer, which will be added to all trace spans. See trace span tags for adding tags to specific types of spans.
Datadog tracing details its sampling and storage capabilities here. You can instruct the Datadog agent to always send a trace to the Datadog backend by setting the DDTags.MANUAL_KEEP tag on the span, documented here. Beware, the Datadog backend may still discard your trace if you exceed your ingest quotas.
On the Example tab, there is a configuration that sets the service.name to overridden-backend-service and adds some customary Datadog tags to all traces (env, span.kind and span.type):
- Required
-
There is nothing to configure if you want to use the default OpenTracing settings including defaulting to
cinnamon.applicationfor the service name and add no default span tags. - Example
-
cinnamon.application = backend-service cinnamon.opentracing.datadog { service.name = overridden-backend-service trace.global.tags = "env:staging,span.kind:server,span.type:web" } - Reference
-
cinnamon.opentracing { # Whether to allow null spans to be activated. # Disabled because null spans are not compatible with Datadog tracer. activate-null-spans = off # Whether to activate dummy spans for context-only trace propagation. # Disabled because context-only spans are not compatible with Datadog tracer. activate-context-only-spans = off datadog { # Any key found at https://docs.datadoghq.com/tracing/setup/java/#configuration may be specified here, minus the 'dd.' prefix # See dd.service.name service.name = null # See dd.service.mapping (e.g., "mysql:my-service-name-db") service.mapping = null # See dd.writer.type (e.g., "DDAgentWriter" or "LoggingWriter") writer.type = "DDAgentWriter" # See https://docs.datadoghq.com/tracing/setup/java/#b3-headers-extraction-and-injection (e.g., "Datadog,B3") propagation.style.inject = "Datadog" # See https://docs.datadoghq.com/tracing/setup/java/#b3-headers-extraction-and-injection (e.g., "Datadog,B3") propagation.style.extract = "Datadog" # See dd.agent.host agent.host = "localhost" # See dd.trace.agent.port trace.agent.port = 8126 # See dd.trace.agent.unix.domain.socket trace.agent.unix.domain.socket = null # See dd.trace.enabled trace.enabled = true # See dd.trace.global.tags (e.g., "key1:value1,key2:value2") trace.global.tags = null # See dd.trace.span.tags (e.g., "key1:value1,key2:value2") trace.span.tags = null # See dd.trace.jmx.tags (e.g., "key1:value1,key2:value2") trace.jmx.tags = null # See dd.trace.header.tags (e.g., "CASE-insensitive-Header:my-tag-name,User-ID:userId") trace.header.tags = null # See dd.trace.annotations trace.annotations = "com.newrelic.api.agent.Trace;kamon.annotation.Trace;com.tracelytics.api.ext.LogMethod;io.opentracing.contrib.dropwizard.Trace;org.springframework.cloud.sleuth.annotation.NewSpan" # See dd.trace.methods (e.g., "package.ClassName[method1,method2,...];AnonymousClass$1[call]") trace.methods = null # See dd.trace.partial.flush.min.spans trace.partial.flush.min.spans = 1000 # See dd.trace.report-hostname trace.report-hostname = false # See dd.trace.health.metrics.enabled trace.health.metrics.enabled = false # See dd.trace.split-by-tag trace.split-by-tags = null # See dd.trace.db.client.split-by-instance trace.db.client.split-by-instance = false # Enable MDC injection? See dd.logs.injection logs.injection = false # See dd.http.client.tag.query-string http.client.tag.query-string = false # See dd.http.server.tag.query-string http.server.tag.query-string = false # See dd.http.client.error.statuses http.client.error.statuses = null # See dd.jmxfetch.enabled jmxfetch.enabled = true # See dd.jmxfetch.config.dir jmxfetch.config.dir = null # See dd.jmxfetch.config jmxfetch.config = null # See dd.jmxfetch.check-period jmxfetch.check-period = 1500 # See dd.jmxfetch.refresh-beans-period jmxfetch.refresh-beans-period = 600 # See dd.jmxfetch.statsd.host jmxfetch.statsd.host = ${cinnamon.opentracing.datadog.agent.host} # See dd.trace.health.metrics.statsd.host trace.health.metrics.statsd.host = ${cinnamon.opentracing.datadog.jmxfetch.statsd.host} # See dd.jmxfetch.statsd.port jmxfetch.statsd.port = 8125 # See dd.trace.health.metrics.statsd.port trace.health.metrics.statsd.port = ${cinnamon.opentracing.datadog.jmxfetch.statsd.port} } }NoteThese settings are defined in the
reference.conf. You only need to specify any of these settings when you want to override the defaults.
Span type vs kind
OpenTracing has a standardised notion of Span kind, io.opentracing.tag.Tags.SPAN_KIND is the Tag name, and its accepted values are:
Tags.SPAN_KIND_SERVER = "server"Tags.SPAN_KIND_CLIENT = "client"Tags.SPAN_KIND_PRODUCER = "producer"Tags.SPAN_KIND_CONSUMER = "consumer"
Some Cinnamon modules will specify this based on the kind of trace they are reporting, where possible.
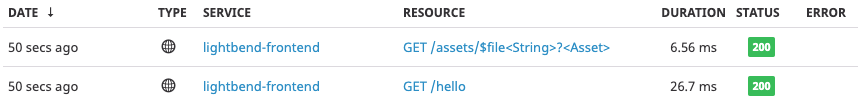
Datadog have their own specialised tag known as a Span type which can be used to filter traces in their tracing frontend. If you don’t specify a span type, the Datadog UI will show the trace type as “Custom” as shown in the below screenshot:

You can specify the Datadog span type by setting the span.type tag (see DDTags) on your spans with one of the following values (see DDSpanTypes):
DDSpanTypes.HTTP_CLIENT = "http"DDSpanTypes.HTTP_SERVER = "web"DDSpanTypes.RPC = "rpc"DDSpanTypes.CACHE = "cache"DDSpanTypes.SQL = "sql"DDSpanTypes.MONGO = "mongodb"DDSpanTypes.CASSANDRA = "cassandra"DDSpanTypes.COUCHBASE = "db"DDSpanTypes.REDIS = "redis"DDSpanTypes.MEMCACHED = "memcached"DDSpanTypes.ELASTICSEARCH = "elasticsearch"DDSpanTypes.HIBERNATE = "hibernate"DDSpanTypes.MESSAGE_CLIENT = "queue"DDSpanTypes.MESSAGE_CONSUMER = "queue"DDSpanTypes.MESSAGE_PRODUCER = "queue"
The previous example specified span.type as web, indicating the service generating traces is an http server. The Datadog UI will show a different icon in the Type column representing the type you have configured.
The following example sets span.type to http, indicating that the entity generating traces is an HTTP client (a frontend in this case).
- Example
-
cinnamon.application = frontend-service cinnamon.opentracing.datadog { trace.global.tags = "env:staging,span.kind:client,span.type:http" }
Split-by-tags
Datadog OpenTracing integration supports dynamic renaming of spans based on another tag, the example in their documentation is cinnamon.opentracing.datadog.trace.split-by-tags = "aws.service" which would rename spans within a trace to be named according to the value in their aws.service tag.
Configuration: Disabling trace decorators
Datadog OpenTracing integration has a number of decorators that are enabled by default, a list of which can be seen here.
Datadog allows you to disable any of these decorators. However, due to the way the Datadog loads its configuration, the configuration to do this must be passed as parameters to the JVM (e.g., -Ddd.trace.dbtypedecorator.enabled=false) or as an environment variable (e.g., DD_TRACE_DBTYPEDECORATOR_ENABLED=false).
Limitations and troubleshooting
Instrumenting an application with both the Cinnamon and Datadog Java agents can create issues when the instrumentations interact. Here are the limitations and workarounds for known issues:
LinkageError: attempted duplicate class definition
When both the Cinnamon and Datadog Java agents are enabled, duplicate class errors can be thrown. For example:
LinkageError: loader 'app' attempted duplicate class definition for HttpExt.
This currently requires a workaround, reverting the Datadog agent to its legacy resolver cache using the following system property:
-Ddd.resolver.cache.config=LEGACY
Or the environment variable:
DD_RESOLVER_CACHE_CONFIG=LEGACY
Java Future instrumentation
It’s possible for Cinnamon’s Java Future instrumentation to be broken when both the Cinnamon and Datadog Java agents are enabled. The Datadog agent may reference Futures during its initialization which will prevent the Cinnamon agent from transforming these classes. To successfully instrument Java Futures in this case, the Cinnamon agent needs to make its transformations first.
If this is an issue, ensure that the -javaagent option for the Cinnamon agent is before the -javaagent option for the Datadog agent in the application’s start command.