OpenTelemetry developer sandbox
Developer sandbox components
The OpenTelemetry ecosystem has many extension points and supported integrations. This developer sandbox uses OpenTelemetry, Prometheus, Loki, Tempo, and Grafana for metrics and events, including example Grafana dashboards for many of the Cinnamon metrics. The following sections contain information about how to configure, run, and explore the sandbox.
Download OpenTelemetry developer sandbox
First download OpenTelemetry developer sandbox and unzip the developer sandbox scripts. You can do this in a terminal with:
curl -O https://downloads.lightbend.com/cinnamon/sandbox/cinnamon-opentelemetry-docker-sandbox-2.20.3.zip
unzip cinnamon-opentelemetry-docker-sandbox-2.20.3.zip
The unzipped directory contains a Docker Compose file, to download and run the Docker containers for the developer sandbox, and a Grafana plugin with dashboards for Cinnamon metrics.
Run your application with OpenTelemetry
Add the OpenTelemetry dependencies to your application:
- sbt
-
libraryDependencies ++= Seq( Cinnamon.library.cinnamonOpenTelemetry ) - Maven
-
<dependency> <groupId>com.lightbend.cinnamon</groupId> <artifactId>cinnamon-opentelemetry</artifactId> <version>2.20.3</version> </dependency> - Gradle
-
implementation group: 'com.lightbend.cinnamon', name: 'cinnamon-opentelemetry', version: '2.20.3'
Run your application, configured with the gRPC metric exporter and the gRPC logs exporter.
- application.conf
-
cinnamon.opentelemetry { metrics { exporters += grpc-exporter } logs { exporters += grpc-exporter } }
By default, the Cinnamon OpenTelemetry grpc-exporter reports the accumulated metrics every minute.
This can be changed, for example with cinnamon.opentelemetry.metrics.grpc-exporter.interval = 10 seconds to get more granular metrics.
Enable tracing (optional)
The OpenTelemetry developer sandbox supports tracing (stored in Tempo and enabled in Grafana). While the Cinnamon OpenTelemetry integration doesn’t currently support tracing directly, the OpenTracing integration can be used with OpenTelemetry. The sandbox has been configured to accept Zipkin traces. Enable tracing with the Zipkin reporter and traces will be exported locally to the developer sandbox and can be explored in Grafana.
Start OpenTelemetry developer sandbox
To run the OpenTelemetry Docker developer sandbox, first change into the unzipped directory at a terminal:
cd cinnamon-opentelemetry-docker-sandbox-2.20.3
Docker
Make sure that Docker is running and then start the developer sandbox using Docker Compose:
docker compose up
Explore in Grafana
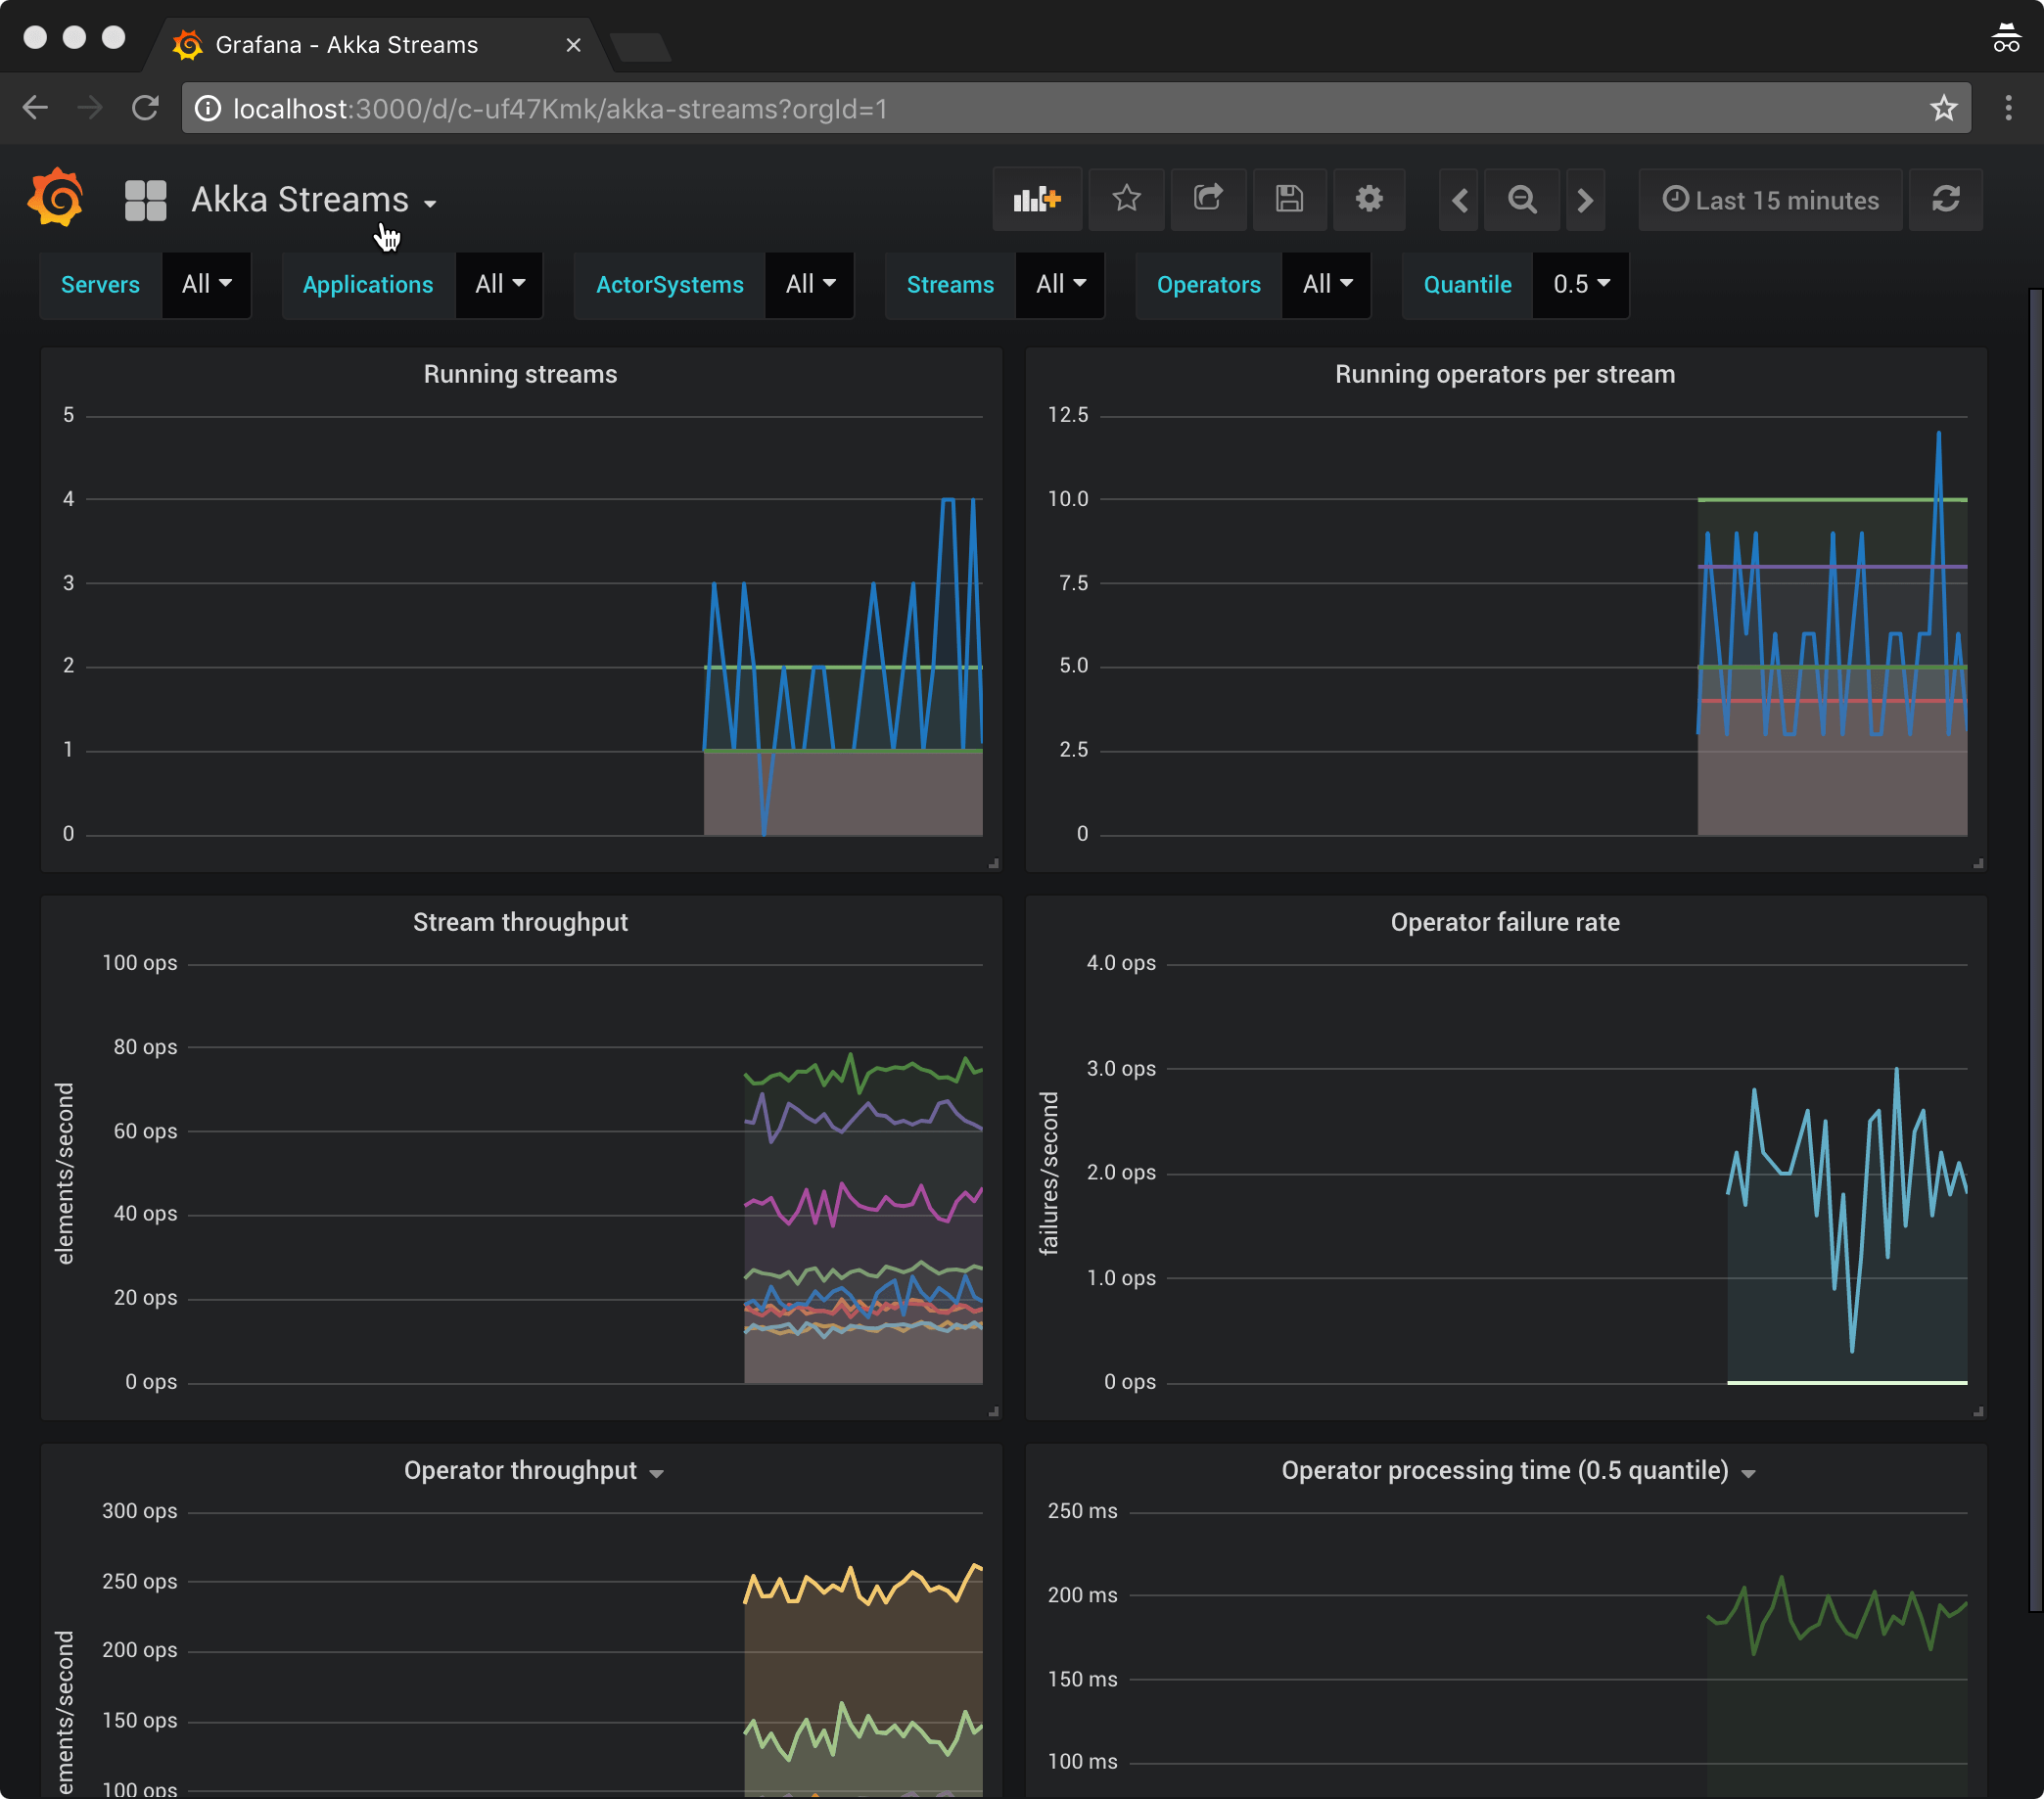
The developer sandbox version of Grafana is available at http://localhost:3000.
You can then view the dashboards, which will begin displaying data from your application:
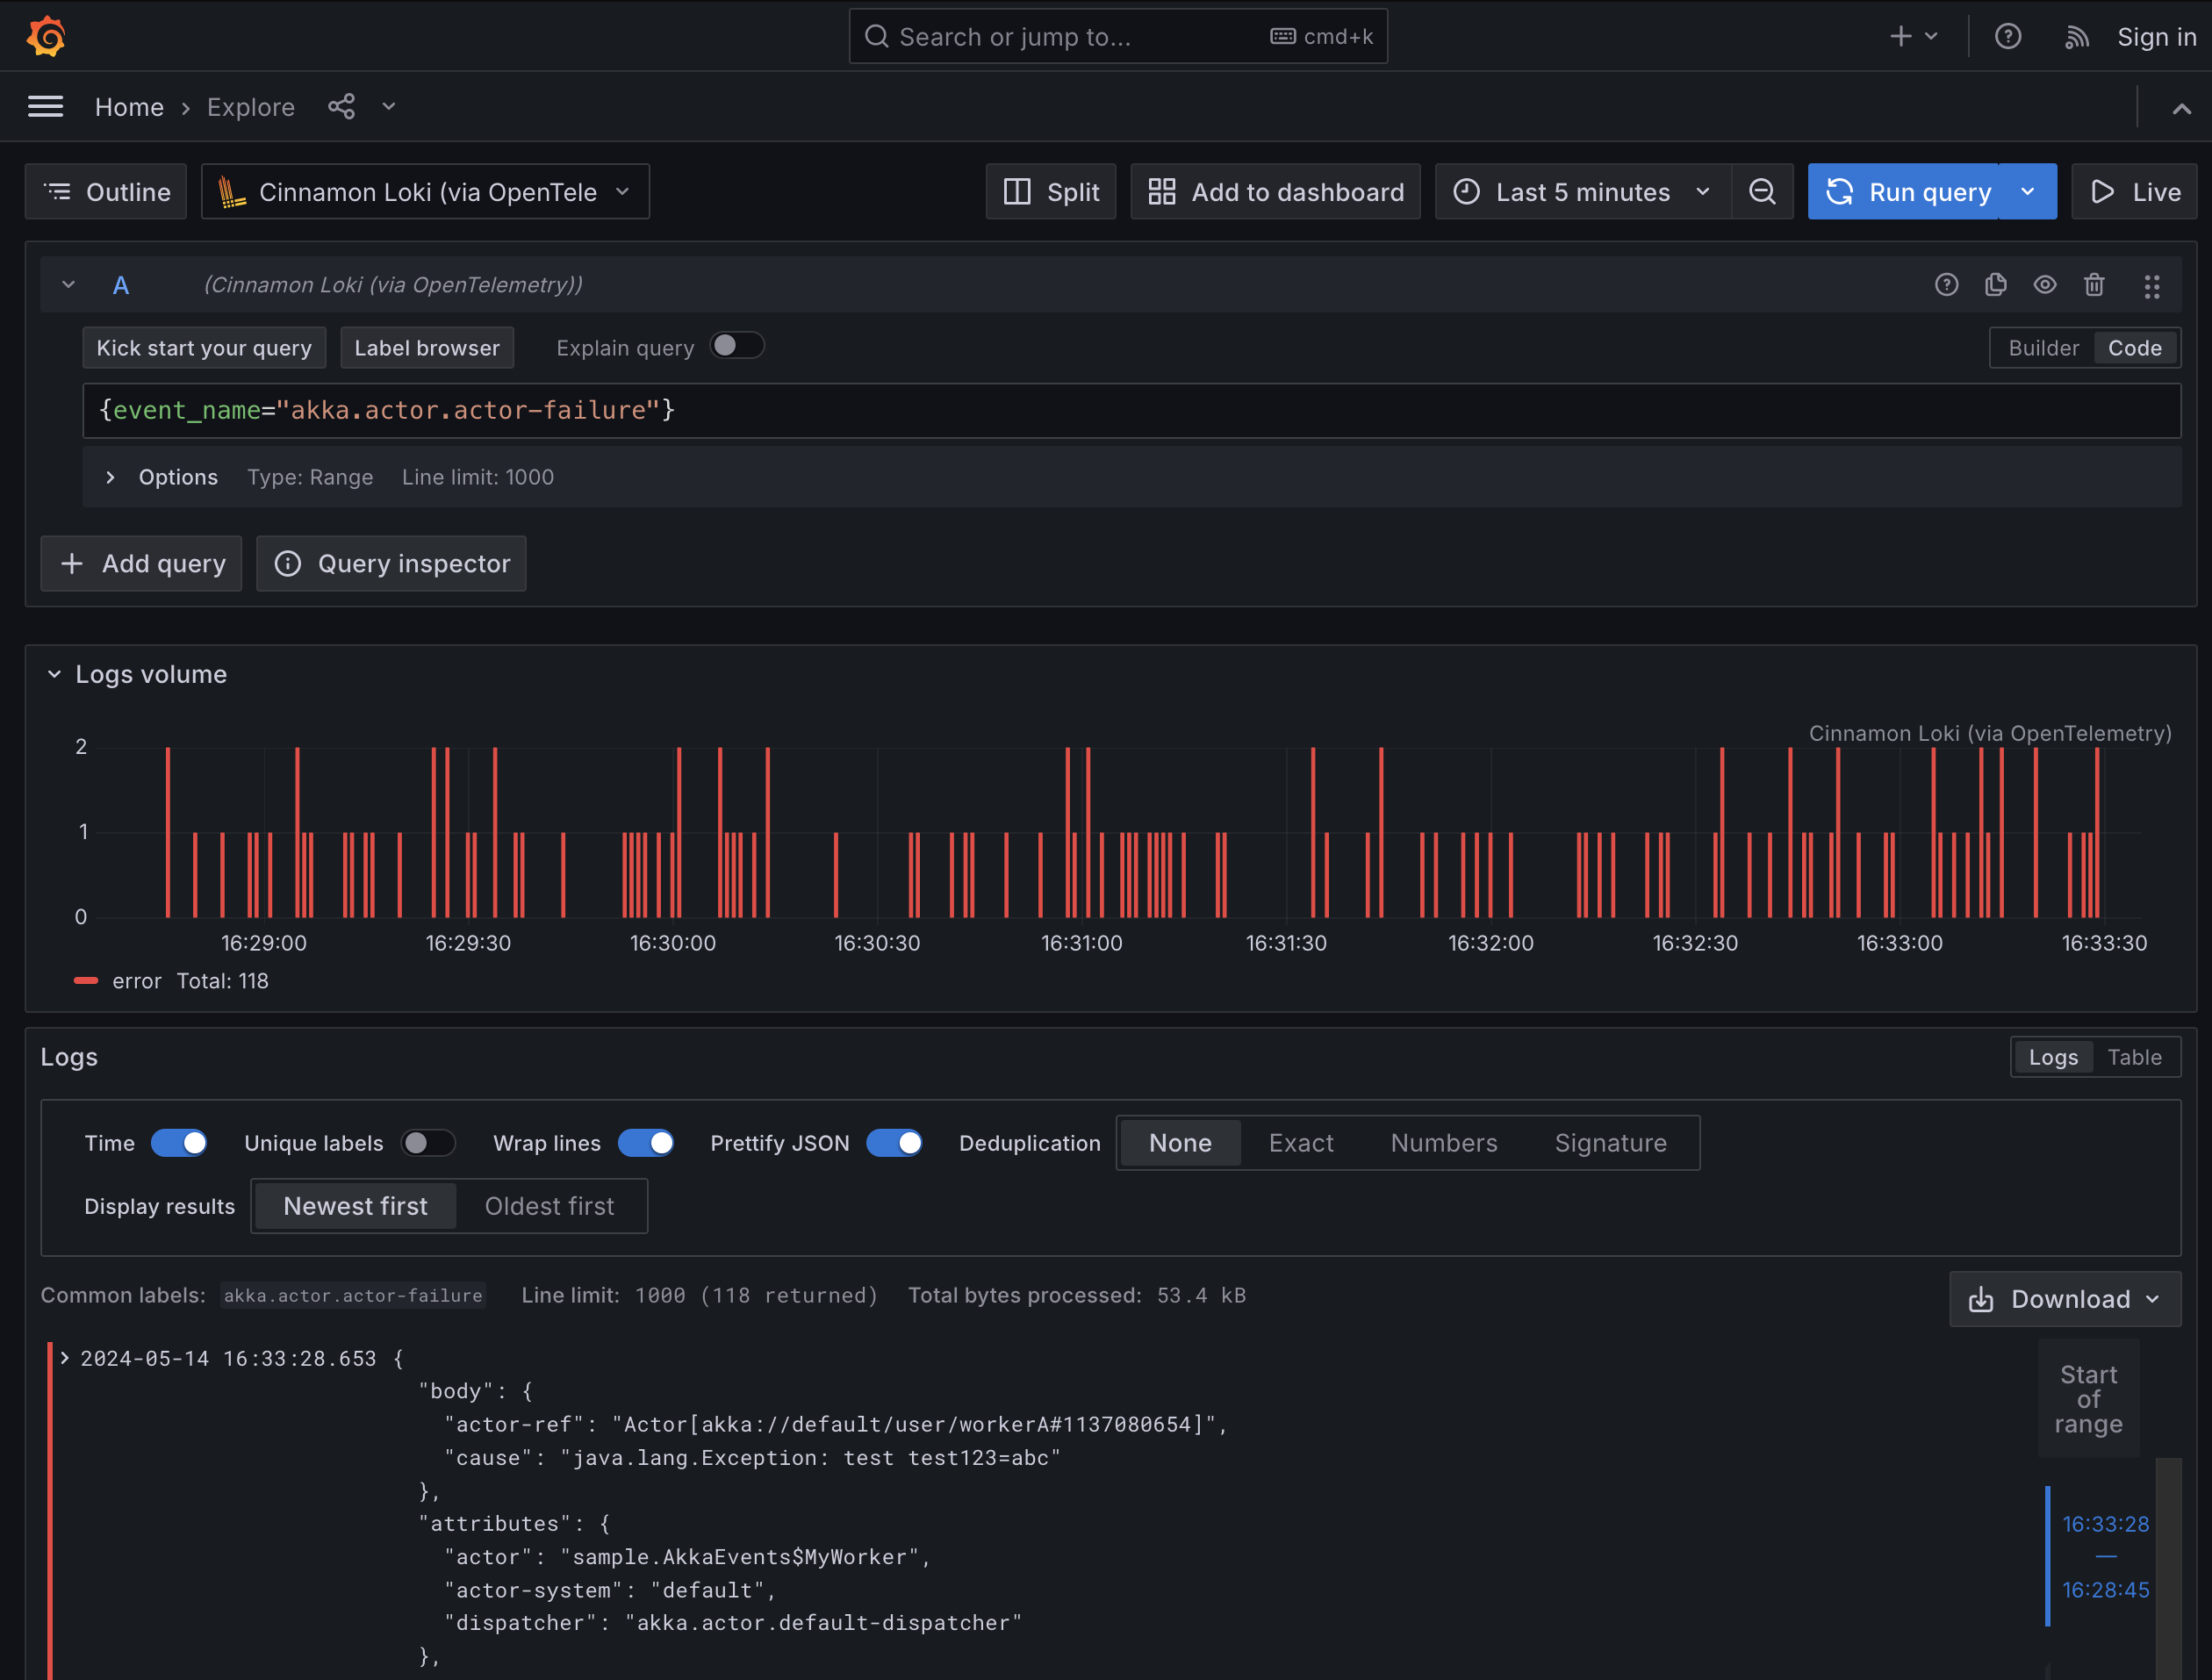
You can explore event logs with Grafana Explore using the configured Loki datasource:
If tracing has been enabled, you can explore traces with Grafana Explore using the configured Tempo datasource.