OpenTracing
OpenTracing is an open standard for distributed tracing. Distributed tracing can be used for optimizing end-user latency (the trace gives a breakdown of where time has been spent in distributed requests), root-cause analysis for errors (errors can be annotated in the trace and show how other parts of a distributed system relate to an error), and understanding the bigger picture of the system (traces can give insight into the distinct pieces of a distributed system and how they are connected).
As an example, here’s a simple message flow across actors:

Actor A sends messages to actors B and C (which is running in a different actor system), and actor C sends a message to actor D.
Here’s what a possible trace for this message flow looks like conceptually:
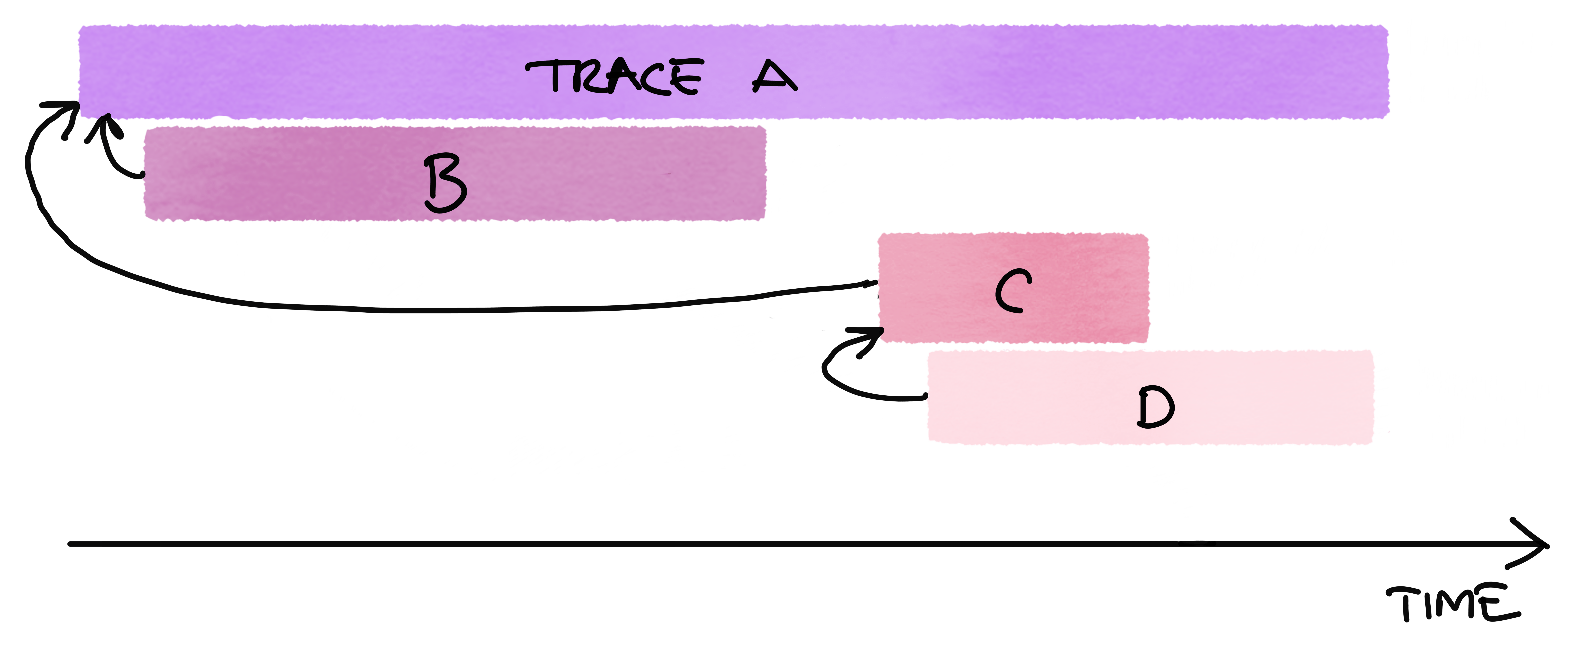
A trace shows a dataflow or an execution path through a distributed system. Each span in the trace represents a logical unit of work. In the case of actors, each span represents the processing of a message by an actor. The duration of the span is recorded. Spans may be nested to model causal relationships, with spans referencing other spans, and for actor tracing these relationships are message sends. Events can be logged within a span.
An actor trace shows the flow of messages, and records when messages were processed and how long it took to process each message. Message sends to other actors are logged within the trace span, as well as any actor events such as actor failures, unhandled messages, dead letters, or logged errors and warnings.
For configuring tracing, or integrating with tracing solutions, see the following documentation: