Grafana
Lightbend Telemetry provides pre-defined dashboards for Grafana, a leading open source software time series analytics.
Grafana integrates with several time-series databases, e.g. Prometheus, Elasticsearch, InfluxDB, etc.
This section describes how to download, install, and use the dashboards in Grafana.
Grafana dashboards
Lightbend Telemetry provides several predefined dashboard templates including:
- Akka metrics : metrics for actors, remote actors, cluster, and more.
- Akka events : actor events (such as dead letters or unhandled messages), cluster events, and more.
- Akka HTTP server and client metrics.
- Akka Stream core and extended metrics.
- Stopwatch metrics : information about Stopwatches that have been programmatically added.
- JVM information : heap and garbage collection information.
- … and more.
The dashboards have been tested with Grafana v4 and v5.
Download dashboards
The example dashboards are packaged in zip files to download:
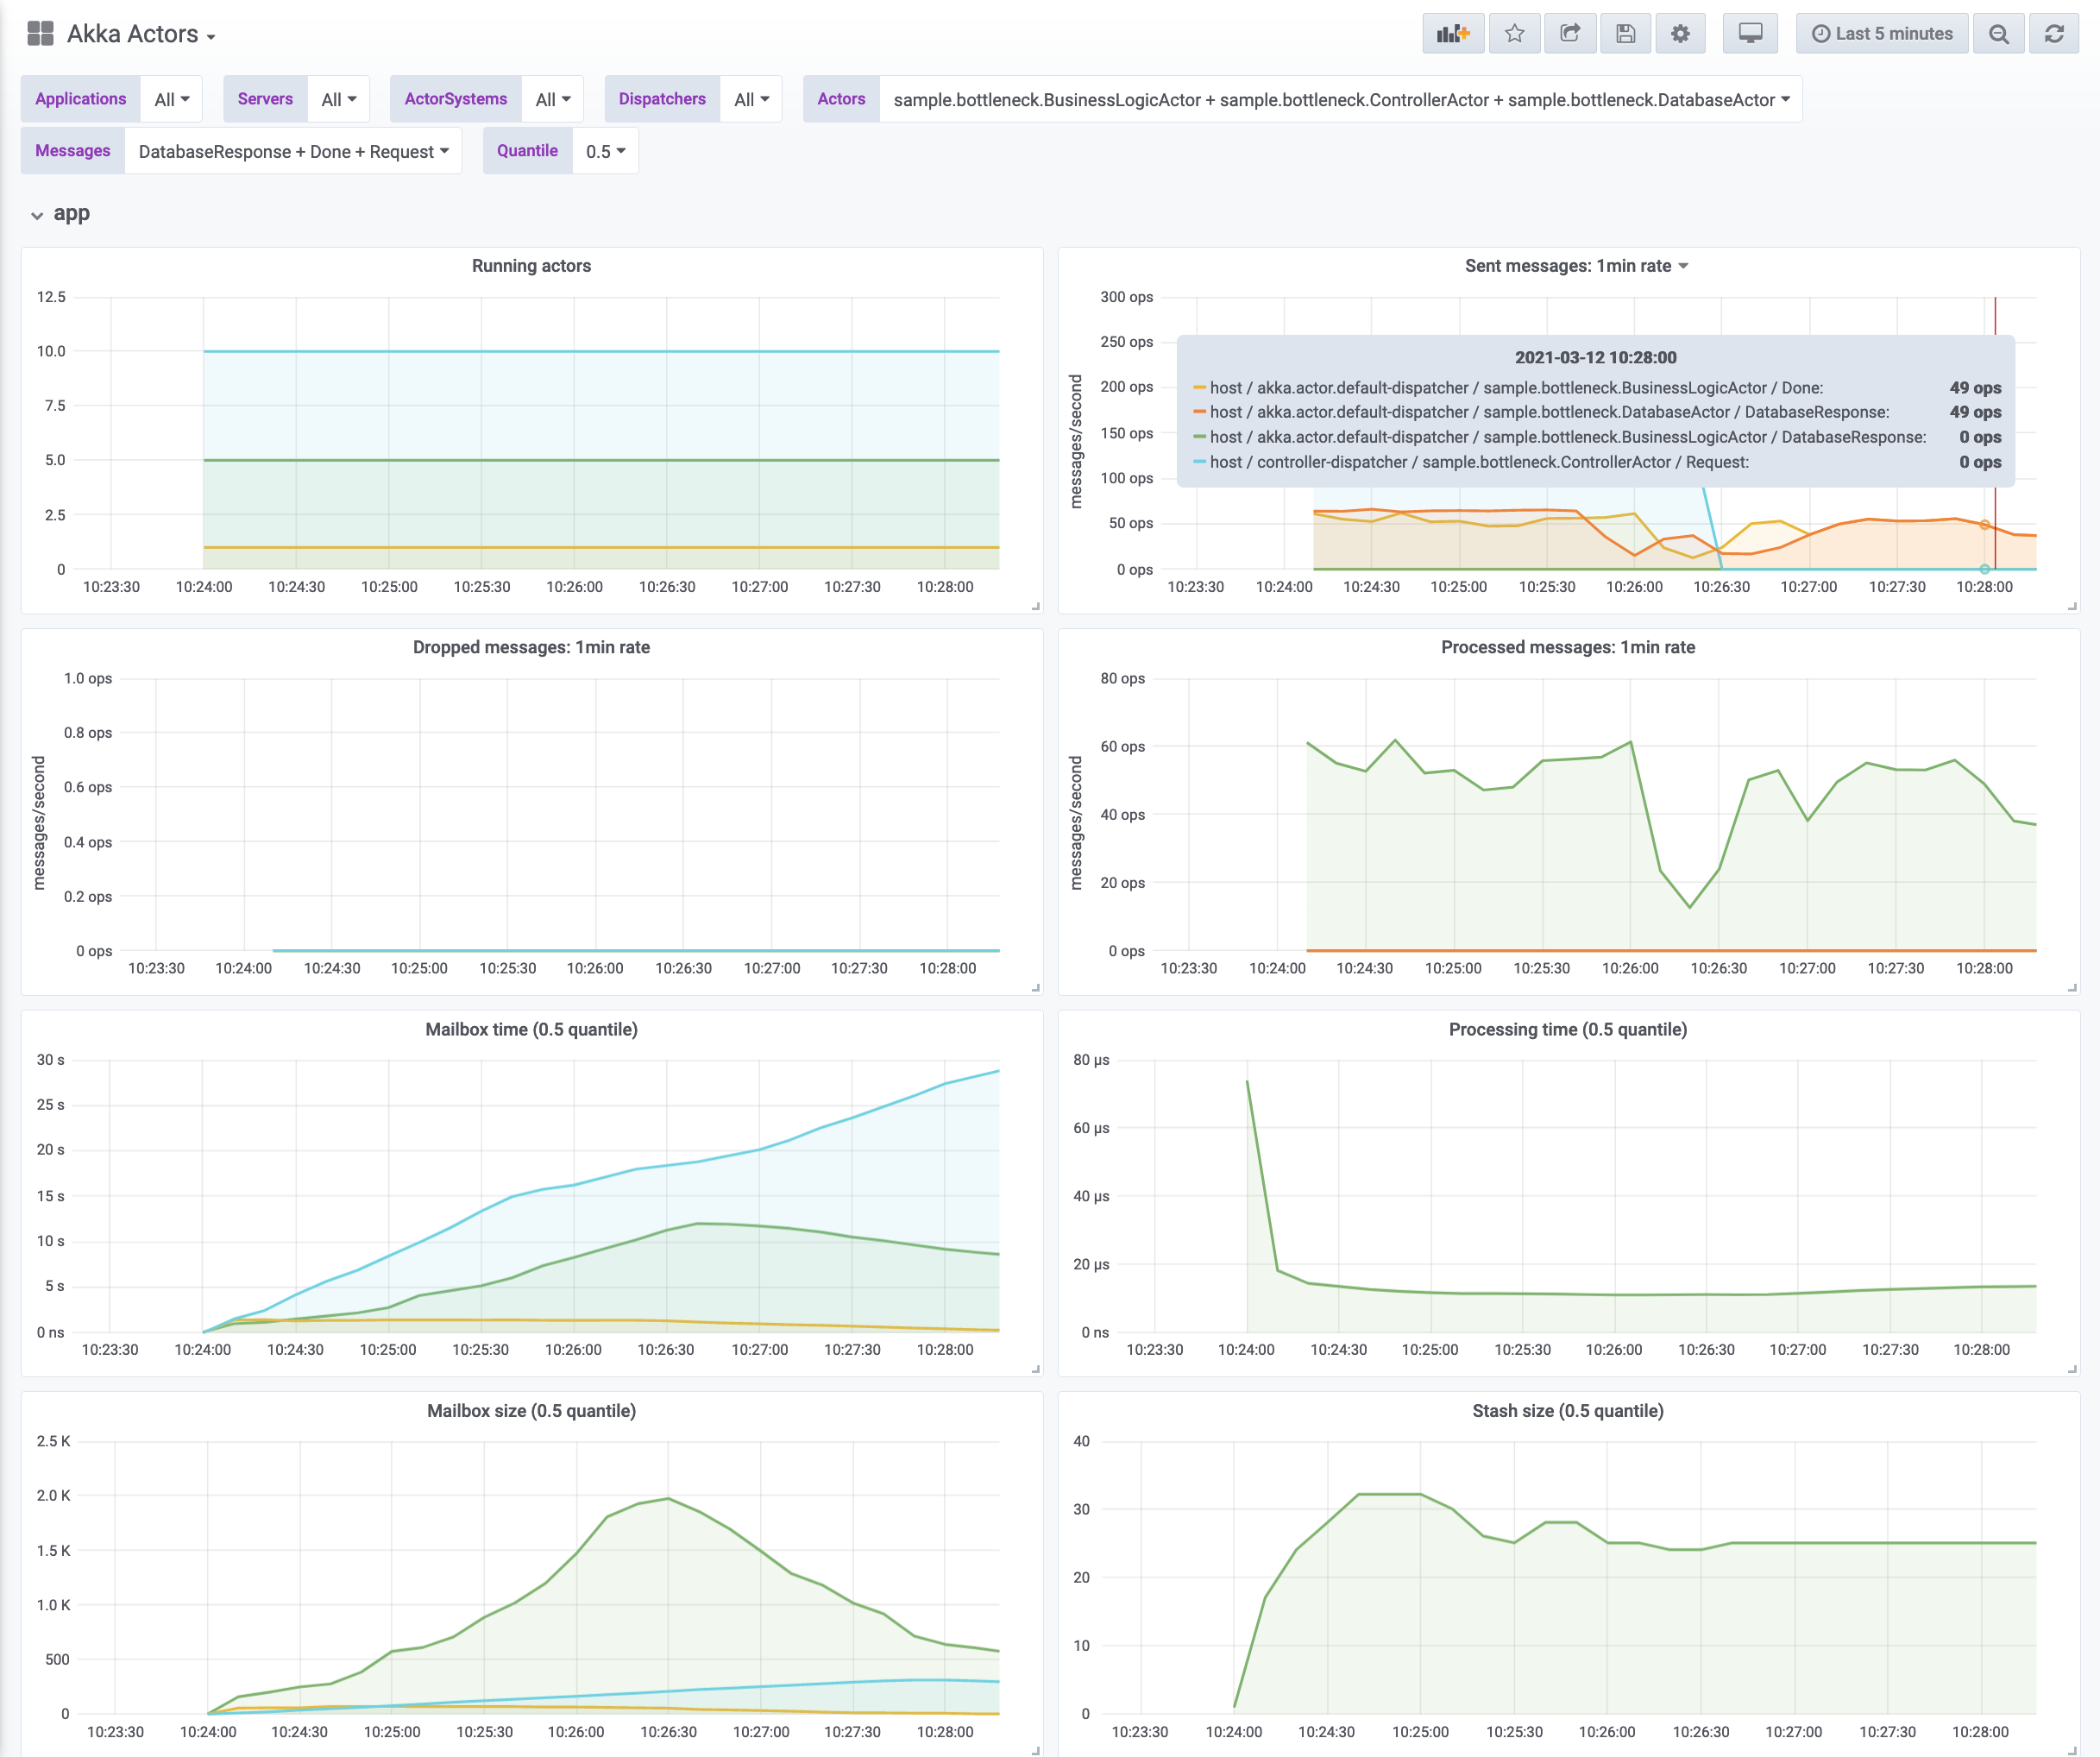
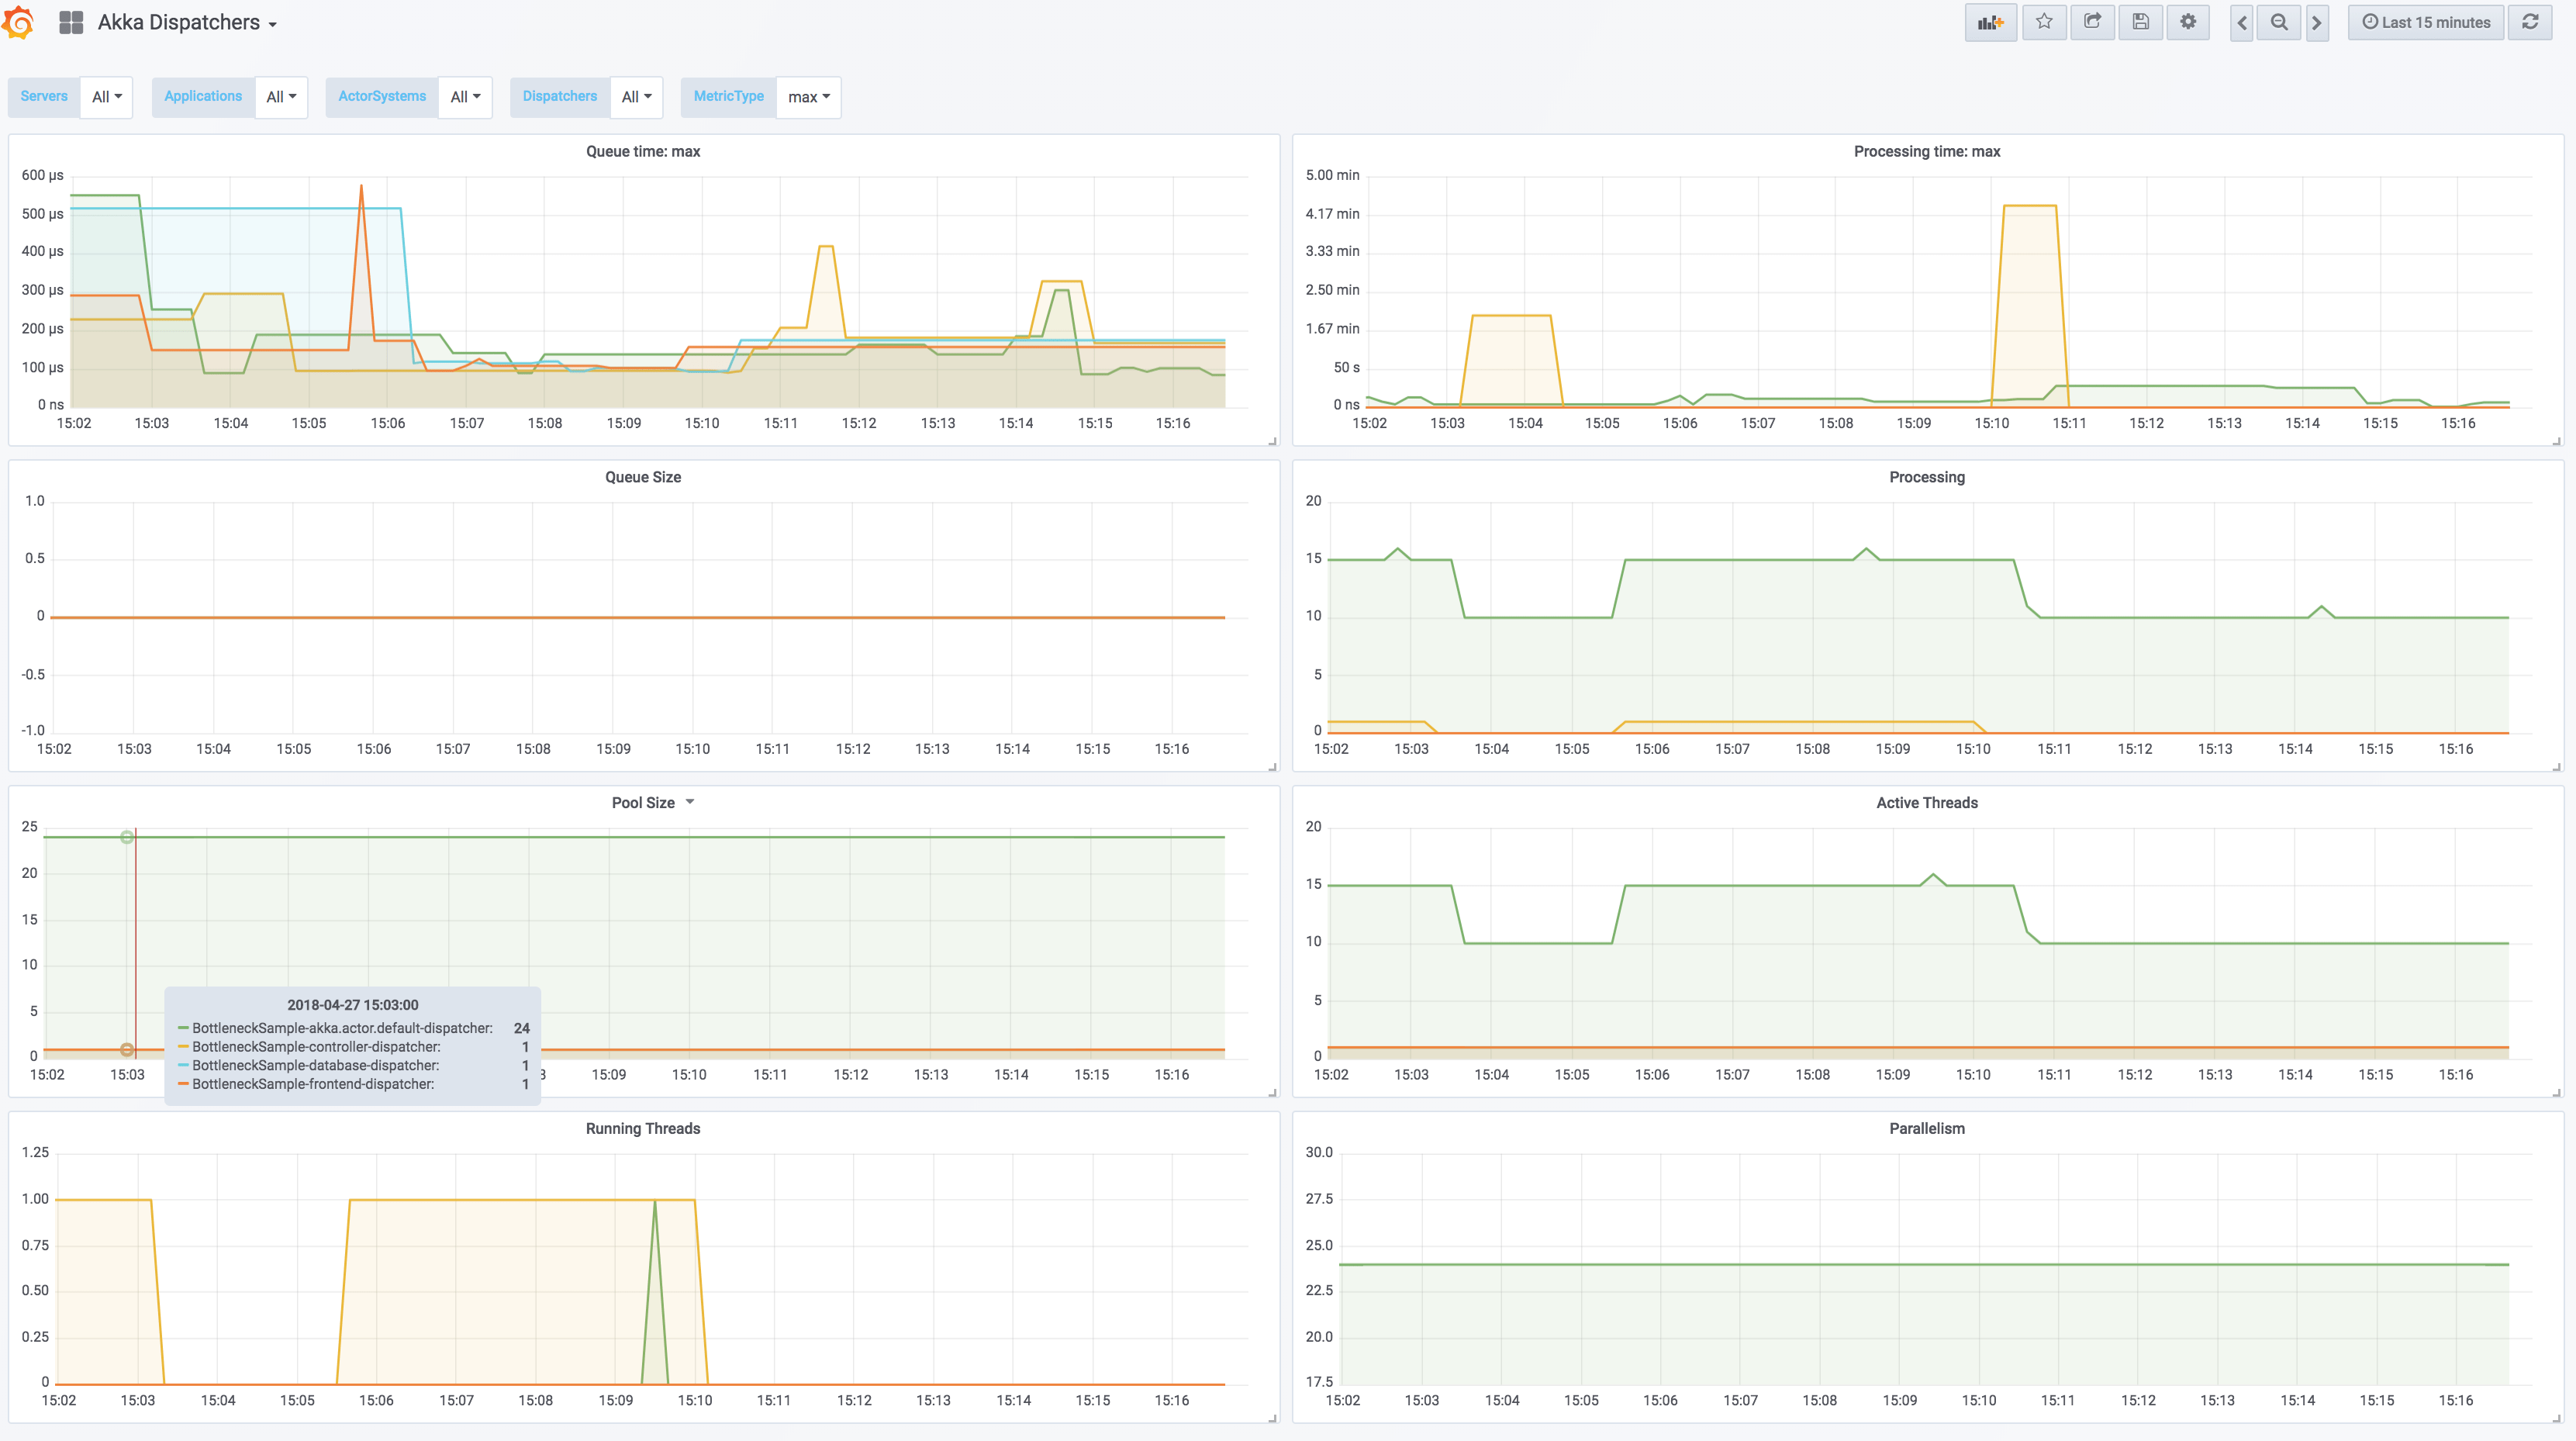
Below you can see the actor and dispatcher dashboards:
Running Grafana
The simplest way to get started with Grafana is to use the Grafana Docker image.
Login
Once Grafana is started you should be able to login (default user/password is admin/admin), and define datasource so Grafana.
Define a data source
Lightbend Telemetry provides dashboards for three different time-series databases; Prometheus, Elasticsearch, and Graphite. Please follow the links below for how how to configure them:
The data source must be correctly named for the templates to work.
- Prometheus - data source name to use:
Cinnamon Prometheus - Elasticsearch - data source name to use:
Cinnamon Elasticsearch - Graphite - data source name to use:
Cinnamon Graphite
Import dashboards
First download dashboards for the data source you’re using, either Prometheus, Elasticsearch, or Graphite. Follow these steps to import dashboards.
Run your application
With Grafana running, a defined data source, and imported dashboards it is time to run the application, have it configured to export into the time-series database of choice, and the graphs will be populated with data points.